CO2, O2, and Biomass Monitoring in Escherichia coli Shake Flask Culture: Following Glucose–Glycerin Diauxie OnlineCO2, O2, and Biomass Monitoring in Escherichia coli Shake Flask Culture: Following Glucose–Glycerin Diauxie Online

Figure 1: The IS-SP integration system allows operators to mount sensor spots to the inside wall of transparent containers. Here it is used to integrate a SP-CD1 carbon dioxide sensor in a shake flask.
Carbon dioxide (CO2) is an important parameter in microbial cultures because it can inhibit or stimulate growth under certain conditions. In our experiment, we monitored Escherichia coli diauxie growth phases online and focused on dissolved CO2 (dCO2) and oxygen readings. We assessed diauxic growth in medium containing glycerin and glucose online with the SFR vario system (from PreSens), which optically measures oxygen, pH, and biomass in an Erlenmeyer flask. The shake flask contained an oxygen sensor spot and an optical CO2 sensor to evaluate sensor performance for online dCO2 monitoring in microbial culture. We determined pH, substrate concentrations, and optical density with offline measurements. Online readings showed the characteristic course of diauxic E. coli growth.
Oxygen and CO2 measurements displayed reverse courses, as expected, indicating high oxygen consumption and simultaneous CO2 production during metabolic activity. But in phases of reduced or stopped growth, the dissolved oxygen (DO) content rose, and the dCO2 level dropped. Online biomass measurements were in good accordance with offline measured OD values. Compared with gas analysis (BlueSens system), DO and dCO2 levels recorded with the SFR vario system showed higher concentration variations.
We evaluated an SP-CD1 optical CO2 sensor spot (from PreSens) that was read out with the SFR vario device for its suitability in online monitoring of microbial cultures. Like the oxygen sensor, the sensor spot was integrated into the shake flask and read out with the reader optics typically used for online pH monitoring. The measurement system allows enables online monitoring of several parameters simultaneously. In addition to measuring biomass, DO, and dCO2 online, we determined pH, substrate concentrations, and OD420 offline. We compared oxygen and CO2 levels to measurements in identical conditions taken with the BCpreFerm (BlueSens) gas analyzer for shake flasks. Measuring several parameters (all showing the same characteristics) enhanced measurement security.
Materials and Methods
We cultured E. coli MG1655 in a chemically defined medium according to Evans (1), with 0.15% glucose and 1 % glycerin as sole carbon sources. We used phosphate buffer to obtain pH 7 medium.

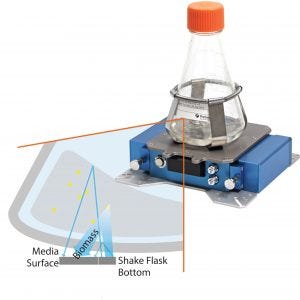
Figure 2: SFR vario system with sensor flask; how optical biomass measurement through scattered-light detection works: A scattered light signal is made of light reflected by the flask bottom by cells inside a medium and by reflectance at the medium’s surface.
We used 500-mL baffled plastic shake flasks with septum and a 200-mL working volume for cultivation. Flasks were equipped with an oxygen sensor spot (SP-PSt3, PreSens). The CO2 sensor spot (SP-CD1, PreSens) was mounted at the flask bottom with an integration system (IS-SP, Figure 1) supplied by the manufacturer. The SFR vario system reads both sensors through the flask bottom, and the reader detects biomass using scattered light (Figure 2). We placed a CO2 sensor where a pH sensor typically is integrated in sensor flasks so that the optics for pH monitoring could read it. We incubated the cultivation at 37 °C and 200 rpm. Online measurements with the SFR vario system were supported by offline monitoring of pH, glucose, and glycerin concentration using respective kits from Megazyme and determination of OD420.
We measured oxygen and CO2 in the gas phase of E. coli culture under the same conditions with the BCpreFerm system, a monitoring device for measuring culture headspace. That system has a larger CO2 measurement range than the SFR vario system and is insensitive to fluorescent components in the medium that might affect optical sensors used with the SFR vario system.
Results

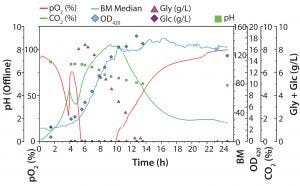
Figure 3: Diauxic E. coli growth on glucose (Glc) and glycerin (Gly) in 500-mL Erlenmeyer flask; biomass was determined online with the SFR vario (blue line) system and offline by OD420 measurements. Oxygen and carbon dioxide were measured online with optical sensor spots and readout with a SFR vario system; pH, Glc, and Gly were determined offline. Two growth phases (first on Glc and then on Gly) can be determined. While oxygen is consumed during high metabolic activity, CO2 is produced. The short lag phase at ∼4.5 h indicates that the preferred substrate has been consumed, so cells switch to metabolizing the second substrate.
Figure 3 shows both online data recorded with the SFR vario system and offline measurements. The graph shows the expected, characteristic course of diauxic E. coli growth. In the first growth phase (∼1–4 hours), glucose is a carbon source, and glycerin is not metabolized. During this phase, biomass rises, oxygen is consumed, and CO2 is produced. Oxygen consumption and simultaneous CO2 production indicate the aerobic metabolization of glucose. After ∼4.5 h, DO level rises again temporarily, and dCO2 decreases. In this phase, the preferred substrate (glucose) is completely consumed, and the cells enter a short lag phase. After a few minutes, the microorganisms switch to metabolize glycerin and continue growing. DO decreases with increasing cell numbers and drops to zero level during this second growth phase. That also is displayed in a slower rise of online biomass and offline OD measurement values. Because of limited oxygen, E. coli cells can no longer grow at their maximum growth rate on glycerin. Their slowed-down growth is reflected in the slight bend of the dCO2 curve around 6 h process time.

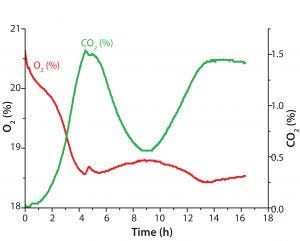
Figure 4: Diauxic E. coli growth on glucose and glycerin in 500-mL Erlenmeyer flask; oxygen and CO2 in gas phase were monitored with the BlueSens system. The metabolic switch from glucose to glycerin after ∼4.5 h is shown as a small peak in the O2 values as cells briefly stop metabolic activity.
One example shows how different parameters measured simultaneously lead to higher reliability of our process understanding. After ∼10 h, the culture enters stationary phase, although glycerin is not completely consumed at this stage. Without substrate consumption, the DO level slowly rises back to 100%, whereas dCO2 slowly decreases. In this experiment, determining the growth rate based on online biomass signal and OD420 values can be difficult. However, also measuring dCO2 allowed us to see slowed down growth after an initial rapid growth phase on glycerin. We expected a drop in dCO2 concentration toward zero at the end of cultivation. But we detected only a slow decrease to ∼1.8% CO2, a very slow progression of O2 and CO2 toward initial values in both liquid and gas phases (Figures 3 and 4). That result might be caused by a slow gas exchange through the shake flask lid and oxygen limitation (from insufficient kLa of the used shake-flask setup). Another possible explanation for further CO2 production is residual activity caused by further consumption either of products that accumulated during the growth phase or of parts of lysed cells.
BlueSens measurements during the gas phase (Figure 4) showed no large concentration changes for O2 and CO2, which was not the case for the dissolved parameter measurements taken with the SFR vario system. Here, O2 levels varied only in a 3% range and CO2 levels for only 1.5%. Oxygen consumption and correlating CO2 production also showed in reverse courses of both graphs (Figures 3 and 4).
The metabolic switch after 4.5 h is visible as a small peak in the O2 readings, which is displayed more clearly in the dissolved-parameter measurements recorded with the SFR vario system. In the next metabolic phase, gaseous CO2 levels show a different course than the dissolved CO2 readings. In the headspace, the CO2 values drop 1% over the next 4–5 h, and the dCO2 readings indicated further CO2 increase in the medium. The oxygen sensor used with the SFR vario system provided exact DO measurements, and the dCO2 readings of the integrated CO2 sensor spot showed an exact reverse course. So the dissolved parameter readings seemed conclusive.
Expedited Culture Monitoring
Our evaluation of CO2 sensors for microbial culture monitoring showed comprehensive results that were in accordance with expected dCO2 development during diauxic growth and indicated cell activity levels very well. We measured O2 levels and verified CO2 readings. Both parameters showed according tendencies. As we expected, comparison with the established BlueSens BCpreFerm system showed that O2 and CO2 concentration changes in gas phase were not as distinct as those recorded in liquid we monitored Escherichia coli diauxie growth phases online and focused on dissolved CO2 (dCO2) and oxygen readings.phase. A similar metabolic phase pattern and reverse O2 and CO2 courses as with the SFR vario system were recorded. Simultaneous online monitoring of several parameters with the SFR vario system enhanced measurement security because all recordings showed the same characteristics, which allowed more precise assessment of current culture status. For this study, it was advantageous that the SFR vario system could be adjusted to read out the CO2 sensor instead of a pH sensor. That did not require a hardware change, but only a settings update. So the online monitoring device saved time for culture monitoring in shake flasks.
Reference
1 Evans CGT, Herbert D, Tempest DW. Chapter 13: The Continuous Cultivation of Microorganisms 2: Construction of a Chemostat. Meth. Microbiol. 2, 1970: 277–327; doi:10.1016/S0580-9517(08)70227-7.
Helga Tietgens is a technical assistant at Max Planck Institut für Dynamik komplexer technischer Systeme, Magdeburg, Germany. Corresponding author Gernot T. John is director of marketing and innovation at PreSens Precision Sensing GmbH, Regensburg, Germany. Katja Bettenbrock is head of experimental systems, biology team, at Max Planck Institut für Dynamik komplexer technischer Systeme.
You May Also Like


