Development and Application of a Simple and One-Point Multiparameter Technique: Monitoring Commercial-Scale Chromatography Process PerformanceDevelopment and Application of a Simple and One-Point Multiparameter Technique: Monitoring Commercial-Scale Chromatography Process Performance
 In commercial-scale biopharmaceutical manufacturing, downstream chromatography steps are still a bottleneck and contribute to significant operational costs (1, 2). Some of those costs are inherent (e.g., resins, large buffer quantities, and cleaning) whereas others are avoidable (e.g., product loss due to rejected lots or deviations that result in production downtime). Maintaining efficient and robust chromatography process performance is therefore critical for minimizing operating costs. To do so, we introduce a simple and one-point multiparameter technique (SOP-MPT) for monitoring chromatographic process performance.
Traditionally, chromatography process performance has been monitored by analytical assays (e.g., those measuring yield, impurities, and molecular integrity) along with visual review of chromatographic profiles by trained personnel. However, such techniques have limitations. Analytical assays are performed for each production lot but not necessarily at each process step, thus creating gaps in process monitoring. Assay results may be unavailable for one to two weeks after a lot is processed. Therefore, a production process is run at risk during the assay testing period, and the sole mitigation for that is visual review, which captures only gross column failures (not emerging process issues).
There is a gap between what traditional process monitoring can detect and how events unfold in real time. Recent efforts to close that gap have driven development of advanced and complex models such as transition and multivariate analyses (3, 4). However, those models require long lead times to develop and can be cost prohibitive. Skilled personnel also are required to extract and compile data and to execute those models in monitoring routine processes. Furthermore, complex models are limited by computational factors such as data collection frequency, high signal-to-noise ratio, and extensive processing requirements (5).
To overcome those limitations, a novel SOP-MPT was developed to enhance routine process monitoring. It has the following salient features:
Evaluates performance of any chromatography step immediately after a process has completed (near real-time)
Identifies emerging process performance issues
Requires no capital outlay and works with current production software capabilities
Improves process understanding and identifies potential opportunities to improve process robustness and yields, reducing quality issues and enhancing process efficiency
Gives production personnel ownership of process monitoring
Acts as a communication tool between management and operators.
Bayer personnel have used SOP-MPT to monitor more than 1,000 commercial-scale lots and detected significant process performance issues such as compromised column packing integrity, column underperformance, and chromatographic skid failures. In addition, the SOP-MPT enhances production efficiency by providing product-quality insights and process-improvement opportunities.
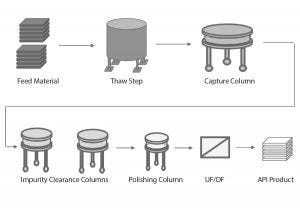
Figure 1: Overview of a generic biopharmaceutical downstream process; UF/DF = ultrafiltration/ diafiltration, API = active pharmaceutical ingredient
Materials and Method
Figure 1 depicts a generic biopharmaceutical downstream process. The frozen feed material is thawed and loaded onto a capture column, and the capture column eluate is then loaded onto a series of columns to remove impurities. After the polishing step, the ultrafiltration/diafiltration (UF/DF) step concentrates and exchanges the product intermediate into the final formulation buffer. Finally, the active pharmaceutical ingredient (API) is frozen for further processing.
Chromatographic Skid Software: Distributed control systems (DCS) software by the ABB Group was used to run the skids with inline sensors for UV, pressure, conductivity, temperature, and flowrate.

Figure 2: SOP-MPT steps 1, 2, and 3 to record the SOP-MPT values of the selected parameter profiles
Development of SOP-MPT: The SOP-MPT is executed through five simple steps listed below (Figure 2) and in Tables 1 and 2:
1) Elution profiles for UV and other parameter (e.g., pressure and conductivity) profiles are selected simultaneously (overlaid) in the DCS (Figure 2A).
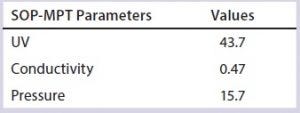
Table 1: SOP-MPT parameters listed in Figure 2C and their corresponding values
2) UV peak maximum is identified (Figure 2B).
3) A marker is placed on the UV peak maximum (Figure 2C).
4) At UV peak maximum (one point), selected parameter values (thus, multiparameter) are determined (Table 1).

Table 2: SOP-MPT values, peak shapes, and visual review data for multiple lots
5) Data determined in Step 4 are compiled for multiple lots (Table 2).
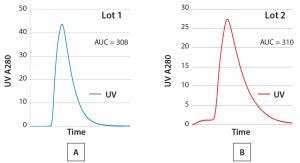
Figure 3: Comparing elution profiles from the same column using a routine qualitative visual review technique (AUC = area under the curve)
Results and Discussion
Comparing SOP-MPT with Visual Review Techniques: The simplicity of the SOP-MPT lies in its ability to capture chromatography process performance through a single snapshot of process parameters at the UV peak max. Because the SOP-MPT relies on parameter values, it is a quantitative technique rather than a qualitative visual review. To illustrate the difference, both techniques were applied to the two lots for which the chromatograms are illustrated in Figures 3A and 3B. A visual review of the chromatograms indicates no significant differences between the two lots because their elution peaks have similar shapes, and the area under the curve (AUC) values are comparable.
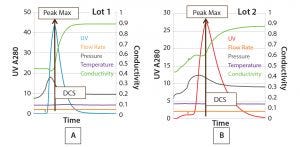
Figure 4: Comparing two elution profiles from the same column step using SOP-MPT
Nevertheless, there are subtle differences between the two lots: The leading baseline and peak height for Lot 2 slightly differ from those in Lot 1. Such differences typically are neglected because a leading baseline in a chromatogram is routinely observed in production processes with no resulting effect on process yield or product quality. The difference in peak height also could be missed because of y-axis scaling or when elution profiles are not directly overlaid (due to software limitations).
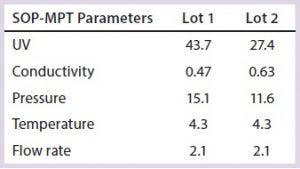
Table 3: SOP-MPT parameters (included for two additional parameter temperature and flow rate) and their corresponding values for Lots 1 and 2
Conversely, use of the SOP-MPT (Figures 4A and 4B, below) gives the values in Table 3, which clearly indicate that the two lots are not comparable. Chromatographic step yield results of both lots (Table 4) confirmed that conclusion. Lot 2 had a column performance issue that was not identifiable through visual review. The SOP-MPT detects subtle changes (start of a channeling) in the chromatographic process that the visual review cannot detect.

Table 4: Step yield for the two different Lots 1 and 2
Case Studies: A Process Monitoring Technique to Detect Emerging Issues
Three cases demonstrate the use of the SOP-MPT as a process monitoring technique for a multistep commercial-scale downstream process. Continuous monitoring and assessment of the SOP-MPT values against historical values (Case 1 and Case 2) provide insight into both process and product characteristics. Further understanding of the interplay between the SOP-MPT parameters (Case 3) enables detection of emerging process issues.
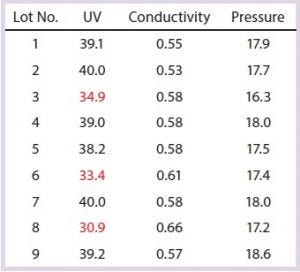
Table 5: Capture column SOP-MPT values; variation in one SOP-MPT parameter (UV) value, with intermittent low UV values highlighted in red
Case 1, Variation in One SOP-MPT Parameter: Table 5 lists SOP-MPT values of the primary capture column. Assessment of those values indicates that the UV values are intermittently lower (highlighted in red), whereas conductivity and pressure remain consistent for each lot.
Note that these values all came from the same column pack. The low UV values were unlikely to be attributable to chromatographic column performance issues: The SOP-MPT UV values of the capture columns were at the expected levels after each low occurrence, and the SOP-MPT UV values of the intermediate and polishing columns (data not shown) for the same lots were normal.
Subsequently, attributes of the column load material were investigated. Because the capture column is the first downstream process step, its load was composed of clarified cell culture harvest. The amount of harvest thawed for each lot was calculated based on titer to maintain a consistent load density (titer/mL of resin). The lots with low SOP-MPT UV values had the highest harvest titers and therefore smaller load volumes. As a result of those smaller load volumes, the total amount of process- (e.g., cell culture media) and product-related impurities (e.g., host-cell proteins, HCPs) was lower in both the load and the eluate. HCP and some media components absorb at 280 nm, which is the UV wavelength used to quantify the elution peak. The low SOP-MPT values therefore were not process performance issues, but rather resulting from load amount variation (presence of fewer impurities).

Table 6: Variation in SOP-MPT UV values with constant conductivity and pressure results in different process performance characterizations depending on the process step.
Similarly, the observed phenomena of lower SOP-MPT UV values with constant conductivity and pressure values at the intermediate and polishing chromatography steps provided additional process and product insights (Table 6). For example, the cell culture process has variability both within a single cell-culture campaign (about three to four months long) and across different campaigns, resulting in different titers and impurity levels in the downstream load material. Load variability manifests in higher or lower SOP-MPT UV values at the capture and intermediate column steps. The intermediate eluate is the load material for the polishing columns, after which a desired purity level should be reached regardless of upstream variability. A low SOP-MPT UV value of the polishing steps indicates lower product levels from process performance issues such as low product binding, incorrect wash/early elution, or irregular peak cutting.
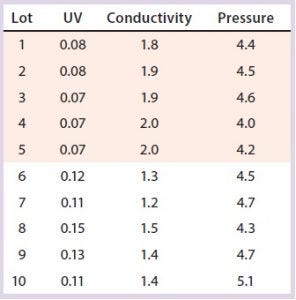
Table 7: Variation in two polishing column SOP-MPT parameter values; beginning from Lot 6, higher UV and lower conductivity SOP-MPT values were recorded.
Variation in one SOP-MPT parameter — UV — led to identification of upstream process variability. That can be well characterized in conjunction with quality attributes such as specific activity and impurity concentrations. This characterization would not have been possible with other established methods of column performance monitoring (e.g., asymmetry and height equivalent to theoretical plate, HETP).
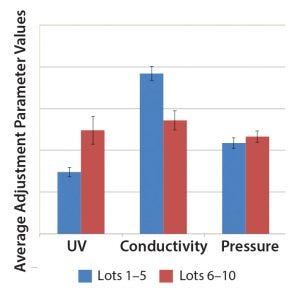
Figure 5: Comparison of three SOP-MPT parameters (UV, conductivity, and pressure), with average values between Lots 1 and 5 and Lots 6 and 10. The error bars represent one SD.
Case 2, Variation in Two SOP-MPT Parameters: Table 7 lists SOP-MPT values of the polishing column and shows a shift in two of them. Beginning with Lot 6 in Table 7, the SOP-MPT UV values were higher, and the conductivity values were lower than for previous lots. Pressure values remained consistent. The shift was confirmed by a comparison of the average SOP-MPT UV and conductivity values for the five lots immediately before the shift and the five lots immediately following it (Figure 5).
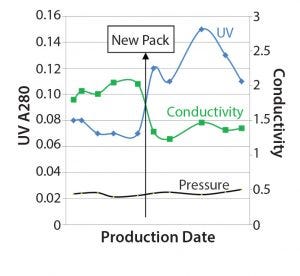
Figure 6: The three SOP-MPT parameters (UV, conductivity, and pressure) values, the “new pack” line indicates when the column was repacked with new resin.
Further investigation revealed that the column had been repacked with new resin immediately preceding Lot 6 (Figure 6). The new column pack therefore directly coincided with the SOP-MPT UV and conductivity value change. Increased SOP-MPT UV with comparable AUC (data not shown) indicates a sharper elution profile and therefore a better chromatographic resolution due to a new column pack. This was confirmed by comparing HETP values with that of the previous column; the new column had lower HETP values (data not shown). The observation of higher resolution resulting from the new column pack through the SOP-MPT eliminated the need to resort to more time-consuming methods.
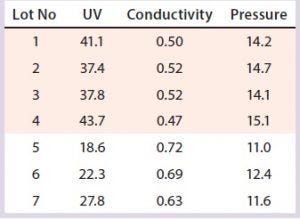
Table 8: Variation in three SOP-MPT parameters (capture column); low UV, high conductivity, and low pressure were observed beginning with Lot 5.
The SOP-MPT can be used to identify similar process performance changes in both capture and intermediate chromatography steps. Although the improved column pack did not alter product quality (because of the step-elution method) in this particular case study, packing process improvements from the column can be applied to other chromatographic steps.
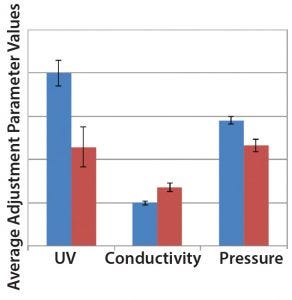
Figure 7: Comparison of SOP-MPT three parameter (UV, conductivity, and pressure) average values between Lots 1–4 (blue bars) and Lots 5–7 (red bars), with error bars representing one standard deviation
Case 3, Variation in Three SOP-MPT Parameters: Table 8 lists historical SOP-MPT values for the capture column. Variation was identified in three SOP-MPT parameter values for the capture column. Beginning with Lot 5 in Table 8, low UV, high conductivity, and low pressure SOP-MPT values were recorded. Comparing the average SOP-MPT parameter values for the four lots immediately preceding the shift and the three lots immediately following it confirmed the SOP-MPT observation (Figure 7).
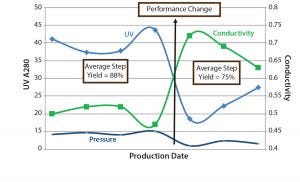
Figure 8: SOP-MPT three-parameter values (UV, conductivity, and pressure); the step yields are calculated as the average of the lots before and after the column beds were compromised.
Those seven lots were processed with the same column pack; therefore, a shift in the values of all three SOP-MPT parameters (UV, conductivity, and pressure) indicated significant column performance concerns. Further investigation revealed a disturbed column bed that led to channeling. High HETP values (data not shown) relative to previous lots confirmed this finding. As Figure 8 shows, the column bed issues led to a significant decrease in step yield. Without the SOP-MPT, the disturbed column bed was identified only through the low step-yield results (Figure 8), which led to several other lots being processed using the compromised column. The SOP-MPT could have served as an early fault-detection tool to identify the emerging column issue and led to an immediate mitigation, preventing adverse impacts on subsequent lots.

Table 9: Sample of a four-stage troubleshooting guide
Enhancing Engagement of Production Personnel in Process Monitoring
The simplicity of the SOP-MPT enables production personnel to extract and compile SOP-MPT values for each lot. Operators and shift supervisors review the SOP-MPT values after each process  step. Production management and other support organizations review the SOP-MPT values every day. Irregular or outlier SOP-MPT values are flagged and immediately investigated by production floor
 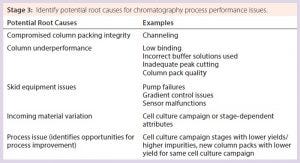 personnel. Depending on the severity (Table 9), those personnel use SOP-MPT trends as a communication tool to convey the urgency to management and other appropriate support organizations to resolve flagged issues. Before implementation of the SOP-MPT, all issues regardless of severity had
 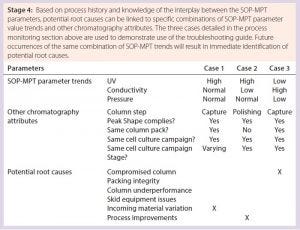 been escalated to other support technical organizations (e.g., manufacturing sciences). That escalation created a significant production bottleneck through unnecessary process stoppage/plant downtime even for minor issues. After implementation of the SOP-MPT, most production issues could be addressed immediately on the floor. Thus, it enhanced production personnel’s involvement in routine process monitoring.
Further Applications for the SOP-MPT — On-the-Floor Troubleshooting: Condensing chromatography process performance into three parameter values enables understanding of chromatography principles and also can facilitate on-the-floor troubleshooting of production issues through understanding of the interplay among those parameters. A general troubleshooting guide that covers each chromatography step can be created because the SOP-MPT can be applied to any chromatography process, regardless of the product, process step, binding mechanism, or elution condition. A guide (Table 9) that links SOP-MPT parameter trends and relevant process attributes to potential process issues can help with immediate identification of potential root causes, reduced production downtime, new process improvement opportunities, and minimal waste. Thus, the SOP-MPT is a simple technique that enhances production efficiency.
A Near Real-Time Monitoring Tool
A novel SOP-MPT was developed as a technique to enhance the production efficiency of a multistep commercial-scale downstream process with no capital cost. Continuous assessment of SOP-MPT parameters (UV, conductivity, and pressure) provides insights into both process performance and product quality characteristics. Understanding of the interplay between the SOP-MPT parameters serves as a near real-time monitoring tool for early fault detection. In addition, the SOP-MPT provides a means of communication between production and management and between production and technical support groups.
Acknowledgment
We thank Lauren Rawlins for providing support in gathering data for this article.
References
1 Farid SS. Economic Drivers and Trade-Offs in Purification Processes. BioPharm Int. 2 March 2009 (supplement).
2 Langer E, Rader RA. Innovation Speeds Discovery, Drives Down Costs, and Improves Productivity. Pharm. Technol. 41(9) 2017; 58‒60.
3 Larson TM, et al. Use of Process Data to Assess Chromatographic Performance in Production-Scale Protein Purification Columns. Biotechnol. Prog. 19(2) 2003: 485‒492; https://doi.org/10.1021/bp025639g.
4 Ündey C, et al. Applied Advanced Process Analytics in Biopharmaceutical Manufacturing: Challenges and Prospects in Real-Time Monitoring and Control. J. Process Control. 20(9) 2010; 1009‒1018; https://doi.org/10.1016/j.jprocont.2010.05.008.
5 Cui Y, Huang Z, Prior J. Using Direct Transition Analysis in Chromatography. BioPharm Int. 31(1) 2018: 34‒40.
Corresponding author Lakshmi Prasad Pathange is a senior manager, Lawrence Huang is senior associate scientist in the Manufacturing Sciences Process Development Labs, and Jonathan Tsang is associate director in global MSAT at Bayer US LLC, 800 Dwight Way, Berkeley, CA 94710; [email protected].
This article appeared as an ebook on the BPI website in May 2018.
You May Also Like


