Validation of Controlled Freezing and Thawing: A 9-L Bottle StudyValidation of Controlled Freezing and Thawing: A 9-L Bottle Study
October 14, 2016
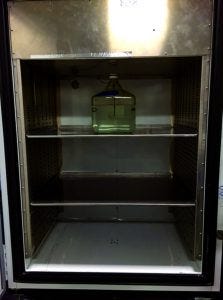
Photo 1: Standard one-bottle position in chamber
Freeze–thaw processes affect the quality of biopharmaceutical proteins (1–13) and human cells (14). It has been reported that no method consistently controls freezing and thawing rates for biological formulations (1). My recent study refutes that claim with validated rate-controlled freezing and thawing of such formulations in 16-L single-use bags (15).
The study reported herein presents a consistent method for controlled-rate freezing and thawing of bottled formulations. It also highlights the effect of load and container position on freeze rates. The freeze–thaw controlled-rate chamber used in this study is a Model 4002 manufactured by Farrar Scientific. It permits rapid, uniform bulk freezing/ thawing of products with temperature ranges from +40 °C to –80 °C. The model has a minimum of 1.7 kW of net cooling and heating capacity over its entire temperature range. Units come equipped with programmable profiles that allow flexibility to meet unique product conditioning.
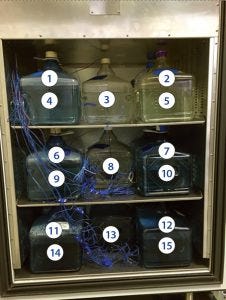
Photo 2: Standard 15 bottle positions in chamber
Experimental Procedure
This study explores the effects of the program temperature profile on the rate of product freezing and thawing. Testing a number of temperature profiles helped determine the best profile for uniformly controlling the freezing rate to the first phase transition (0 °C) and the cooling rate from the first phase transition (–30 °C). The target time to break from the first phase transition was 11–21 hours, and target product cooling rates from –5 °C to –30 °C were 0.2–0.9 °C/min. The target thaw rate was as fast as possible without overshooting a particular temperature.
Tap water simulates a water-based biological formulation. It is more stable than a buffered isotonic solution over the course of multiple freeze–thaw cycles, providing for reproducible results. After comparing tap water with buffered solutions, my company has found very good agreement in experimental results and those calculated for buffer solutions based on water experiments. Tap water must meet local quality standards, with contaminants at such a low concentration that associated errors in freeze–thaw results would be less substantial than those from other possible sources. The company has successfully conducted validatable qualification studies with clients using tap water.
This study involves polycarbonate bottles (10-L capacity with 9-L fill). For a one-bottle test, a bottle was placed in the middle of the top shelf in the unit, the objective being to maximize air flow to its entire outer surface as uniformly as possible (Photo 1). The bottle held 9 L of tap water and had a thermocouple placed through the middle of its closure, with the tip located halfway between the bottom and top surfaces of the contents. The end of the thermocouple also was equidistant from all bottle sides (located in the geometric center). That is the expected last point to freeze if thermal energy is removed from the entire liquid surface at the same rate.
Our validation team established freezing cooling-rate maximums for small and large loads before determining the freezing requirements. Thus, the controlled-rate chamber was set up according to the program described in the “Test 1” box.
Test 1 Procedure |
|---|
Step 1: Timed event to –80 °C in 10 seconds |
Step 2: Wait for process (set point temperature of Step 1 reached before Step 3) |
Step 3: Soak (hold temperature constant) for 12 hours |
Step 4: Wait for event (no changes until manual change) |
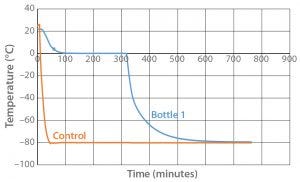
Figure 1: Controlled-rate freeze Test 1 (one 9-L bottle)
Results and Discussion: Freezing
Figure 1 shows the results of controlled-freeze Test 1. It took 317 minutes for the water to fully change phase and 332 minutes for it to reach –30 °C. Table 1 shows the cooling rates from –5 °C to –30 °C: 1.7–2.3 °C/min. The cooling rate is slowest going from –20 °C to –30 °C because there is less difference between the temperature of the air (–80 °C) and that of the product.

Table 1: Test 1 cooling rates
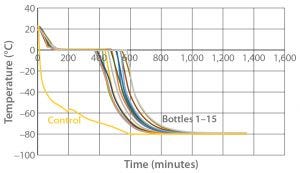
Figure 2: Controlled-rate freeze Test 2 (15 9-L bottles)
Test 2 conducted with the same temperature profile used 15 bottles arranged to maximize air flow to all their surfaces as uniformly as possible (Photo 2). Figure 2 and Tables 2 and 3 show the freezing and cooling rates for this test. The time it took for every bottle to change phase (freeze time) ranged from 369 minutes to 544 minutes. Cooling rates from –5 °C to –30 °C ranged from 0.3 °C/min to 1.6 °C/min.

Table 2: Test 2 cooling rates for bottles 1–8

Table 3: Test 2 cooling rates for bottles 9–15
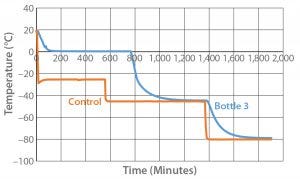
Figure 3: Controlled-rate freeze test 3 (one 9-L bottle)
Because both the small-load (one bottle) and large-load (15 bottles) tests showed cooling rates faster than our target, we designed and conducted Test 3 (one 9-L bottle) with an adjusted temperature profile as described in the “Test 3” box. Figure 3 and Table 4 show the resulting cooling rates. The time for the product to fully change phase (767 minutes) fell within the desired time range. Cooling rates from –5 °C to –30 °C also fell within the desired range.

Table 4: Test 3 cooling rates
Test 3 Procedure |
|---|
Step 1: Timed event to –25 °C in 10 sec |
Step 2: Wait for process |
Step 3: Soak for nine hours |
Step 4: Timed event to –45 °C in 10 sec |
Step 5: Wait for process |
Step 6: Soak for 13 hours |
Step 7: Timed event to –80 °C in 10 sec |
Step 8: Wait for process |
Step 9: Soak for eight hours |
Step 10: Wait for event |
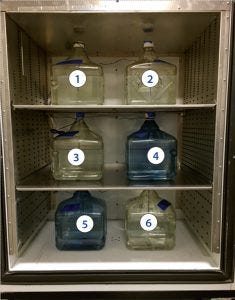
Photo 3: Standard six-bottle positions in chamber
Because the correct temperature profile had been determined with one bottle, Test 4 used that same temperature profile with six bottles. For this six-bottle test, bottles were arranged side by side on each shelf as Photo 3 shows. Figure 4 and Table 5 give the cooling rates for each bottle. The six bottles fully changed phase in 779–922 minutes. The single bottle (Test 3) fully changed phase at 767 minutes, within 12 minutes of the six-bottle temperature range. Additionally, all six bottles’ cooling rates from –5 °C to –30 °C fell in the desired range, just as the single bottle in Test 3 had done. These results show that freezing and cooling rates are independent of product load or bottle position.
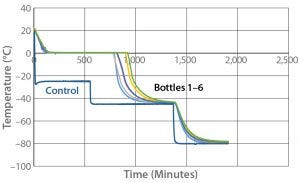
Figure 4: Controlled-rate freeze test 4 (six 9-L bottles)

Table 5: Test 4 cooling rates
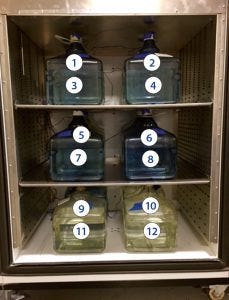
Photo 4: Standard 12-bottle positions in chamber
With the correct temperature profile determined with both one bottle and six bottles, Test 5 used the same temperature profile with 12 bottles. For this 12-bottle test, we arranged the bottles as Photo 4 shows. Figure 5 and Table 6 give the cooling rates for each bottle. All 12 bottles fully changed phase in 769–977 minutes. That range encompasses the six-bottle range and is within two minutes of the one-bottle test, again showing that freezing rate is independent of product load. Additionally, all 12 bottle cooling rates from –5 °C to –30 °C fell into the desired range just like the six-bottle and one-bottle tests. These results indicate that the cooling rate does not depend on bottle position in the chamber or the number of bottles loaded.

Table 6: Test 5 cooling rates
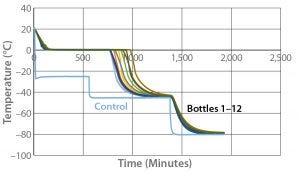
Figure 5: Controlled-rate freeze test 5 (12 9-L bottles)
All the odd numbered bottles (those positioned on the left side of the chamber) fully changed phase in less time than the even numbered bottles positioned beside them. This is to be expected because air flow enters the chamber from its top left corner, then flows down and out of a duct toward the right side.
Bottle 4 showed the fastest cooling rate from –5 °C to –30 °C. That was also expected because the other three bottles on the top shelf were ≤ –20 °C when bottle 4 fully changed phase. Bottle 9 had the slowest cooling rate from –5 °C to –30 °C, and Bottle 10 was the last to fully change phase. Those results were again expected because the bottom floor of the cabinet has the least amount of air flow in contact with the bottles.
Results and Discussion: Thawing
Fast thaw rates are best for preventing damage to biological formulations (2). However, most biological formulations are temperature sensitive. Therefore, this study shows how the maximum product temperature could be controlled as well as thaw rate. The thaw test temperature profile starts with product at –80 °C and ramps to +20 °C as fast as possible. For the purpose of this study, the time it took for each bottle to reach to +2 °C is recorded as its thaw time.
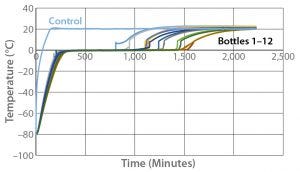
Figure 6: Controlled-rate thaw test 6 (12 9-L bottles)
Figure 6 shows the thaw results from Test 6. The 12 bottles reached +2 °C in the range of 807 minutes (Bottle 1) to 1,549 minutes (Bottle 8). As was the case with odd-numbered bottles positioned on the left side of the chamber freezing faster, they also thaw faster than each even-numbered bottles positioned beside them. The odd-numbered bottles show relatively tight thaw rate control, with 479 minutes separating the thaw time of the first odd-numbered bottle from that of the last odd-numbered bottle. The even-numbered bottles also show relatively tight thaw rate control, with 446 minutes separating the thaw time of the first even-numbered bottle from that of the last even-numbered bottle.
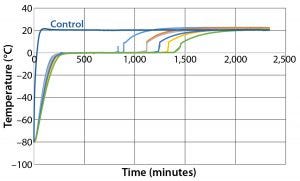
Figure 7: Controlled-rate thaw test 7 (six 9-L bottles)
To test load effects, thaw Test 7 was designed and conducted with the same conditions using six bottles (Figure 7). Those six bottles reached +2 °C in the range of 892 minutes (Bottle 1) to 1,412 minutes (Bottle 6), within the range of the 12 bottles in Test 6. Thus, thaw rates are as independent of load as are freezing rates. Again, the odd- and even-numbered bottle thaw rates were controlled independently of bottle position in the chamber.
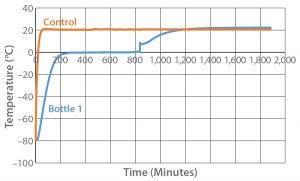
Figure 8: Controlled-rate thaw test 8 (one 9-L bottle)
To further test the effect of load, thaw Test 8 was designed and conducted with the same conditions used with one bottle (Figure 8). The bottle reached +2 °C in 836 minutes, which is within the range of all 12 bottles in Test 6. This further indicates that thaw rate was controlled independent of load.
A Validated Method
We successfully developed a method to control the desired freezing and thawing rate of biological formulations using modern equipment. It was validated with different loads (one, six, and 12 bottles) and bottle positions in the unit chamber. My company has developed a program that clients can use to reliably and uniformly bulk freeze and thaw their own biological formulations.
References
1 Puri M, et al. Evaluating Freeze–Thaw Processes in Biopharmaceutical Development: Small-Scale Study Designs. BioProcess Int. 13(1) 2015: 34–45.
2 Cao E, et al. Effect of Freezing and Thawing Rates on Denaturation of Proteins in Aqueous Solutions. Biotechnol. Bioeng. 82(6) 2003: 684–690.
3 Radmanovic N, et al. Understanding the Freezing of Biopharmaceuticals: First-Principle Modeling of the Process and Evaluation of Its Effect on Product Quality. J. Pharma. Sci. 102(8) 2013: 2495–2507.
4 Reinsch H, et al. Examining the Freezing Proess of an Intermediate Bulk Containing an Industrially Relevant Protein. Enzyme Microbial Technol. 71, 2015: 13–19.
5 Bhatnager BS, Bogner RH, Pikal MJ. Protein Stability During Freezing: Separation of Stresses and Mechanisms of Protein Stabilization. Pharm. Dev. Technol. 12(5) 2007: 505–523.
6 Rathore N, Rajan RS. Current Perspectives on Stability of Protein Drug Products During Formulation, Fill, and Finish Operations. Biotechnol. Prog. 24(3) 2008: 504–514.
7 Shamlou PA, et al. A New Scalable FreezeThaw Technology for Bulk Protein Solutions. Biotechnol. Appl. Biochem. 46, 2007: 13–26.
8 Rodriques MA, et al. Effect of Freezing Rate and Dendritic Ice Formation on Concentration Profiles of Proteins Frozen in Cylindrical Vessels. J. Pharm. Sci. 100(4) 2010: 1316–1329.
9 Maity H, Karkaria C, Davagnino J. Mapping of Solution Components, pH Changes, Protein Stability and the Elimination of Protein Precipitation During Freeze-Thawing of Fibroblast Growth Factor 20. Int. J. Pharm. 378(1–2) 2009: 122–135.
10 Kueltzo LA, et al. Effects of Solution Conditions, Processing Parameters, and Container Materials on Aggregation of a Monoclonal Antibody During Freeze-Thawing. J. Pharm. Sci. 97(5) 2008: 1801–1812.
11 Chang BS, Kendrick BS, Carpenter JF. Surface-Induced Denaturation of Proteins During Freezing and Its Inhibition By Surfactant. J. Pharm. Sci. 85, 1996: 1325–1330.
12 Jiang S, Nail SL. Effect of Process Conditions on Recovery of Protein Activity after Freezing and Freezing–Drying. Eur. J. Pharm. Biopharm. 45, 1998: 249–257.
13 Strambini GB, Gabellieri E. Protein in Frozen Solutions: Evidence of Ice-Induced Partial Unfolding. Biophys. J. 70, 1996: 971–976.
14 Ware CB, Nelson AM, Blau CA. Controlled-Rate Freezing of Human ES Cells. BioTechniques 38(6) 2005: 879–883.
15 King J. Validation of Controlled Freezing and Thawing Rates: A 16-L–Bag Study. BioProcess Int. 14(5) 2016: S44–S50.
Jerry King, PhD, is a senior scientist at Farrar Scientific, 30765 State Route 7, Marietta, OH 45750; 1-740-374-8300; [email protected]; www.farrarscientific.com.
You May Also Like


