Enhanced Biosimilar Product Characterization: A Case Study Using Raman Spectroscopy Combined with Dynamic Light ScatteringEnhanced Biosimilar Product Characterization: A Case Study Using Raman Spectroscopy Combined with Dynamic Light Scattering

The Zetasizer Helix system combines Raman spectroscopy with dynamic light scattering. MALVERN INSTRUMENTS (WWW.MALVERN.COM)
Biophysical characterization has drawn great attention from the biopharmaceutical industry and regulatory agencies across the globe, especially for use in biosimilar drug product development. Currently available biophysical characterization tools can help in screening and optimizing better (more stable) formulations for such products. However, most tools cannot be used for head-to-head comparison of the biophysical properties of an optimized biosimilar formulation with those of an innovator product at higher concentrations.
We developed and optimized a formulation for monoclonal antibody MAb B (a biosimilar product to innovator product MAb A) in an iterative way by using typical biophysical tools — dynamic light scattering (DLS), evaporative light scattering (ELS), and differential scanning calorimetry (DSC) — with traditional antibody stability assessment tools: size-exclusion chromatography (SEC) and cation exchange (CEX). We also evaluated certain concentration-dependent parameters: viscosity (using a Viscosizer 200 instrument from Malvern Instruments), interaction parameter (kD) using DLS, and osmotic second virial coefficient (B22) using static light scattering (SLS). Furthermore, we quantified the size and numbers of subvisible particles using nanoparticle tracking analysis (NTA) (1).
To better characterize a protein’s stability profile, it is essential to perform experiments at the formulated conditions of that protein: the desired protein concentration of product with all associated excipients. Raman spectroscopy offers a unique opportunity to do so by elucidating secondary structure and tertiary markers simultaneously in highly concentrated protein samples with several known pharmaceutical excipients. Coupled with back-scattering DLS, it can provide a real-time profile of structure and aggregation concurrently for the same sample.
We used a Zetasizer Helix instrument (combining Raman spectroscopy and DLS) to compare comprehensive biophysical property profiles for MAb A (innovator product) and MAb B (biosimilar product in a modified formulation), having obtained them at formulated conditions (50 mg/mL). MAb B had a higher Tm onset and Tagg than MAb A at about 4 °C. However, we observed no significant secondary and tertiary structural differences, but a noticeable difference appeared in the disulfide bond region. Isothermal incubation data further support our contention that MAb B was more thermally stable than MAb A. Specifically, MAb A aggregated with larger particle sizes >80 nm after incubation at 60 °C, whereas MAb B particle sizes remained consistent at ~20 nm.
Methods
For the DLS-Raman experiments, we used a Zetasizer Helix system (Malvern Instruments), which combines DLS collected at the 173° back-scattering angle from a 632-nm laser with Raman spectroscopy excited by a 785-nm laser with ~280 mW power. For a typical experiment, a ~50-μL sample would be loaded into a specialized titanium cuvette and placed into a Peltier temperature-controlled sample compartment with quartz windows. Then Raman and DLS data were acquired sequentially. To properly process the data, we obtained Raman spectra of corresponding buffers under identical conditions with the same experimental set-up. Unless otherwise noted, we collected a single Raman spectrum with 10 coadditions of a 40-second exposure.
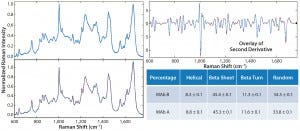
Figure 1: Representative Raman spectra of MAbs A and B in formulations at 25 °C (left panel, with legends for MAb identity); second-derivative overlay of Raman spectra for MAbs A and B (top right panel); and comparison of deconvoluted secondary-structure percentages for MAbs A and B (bottom right panel)
Results and Discussion
Raman Spectral Comparisons: First, we examined MAb samples in the original formulation without dilution. Then we compared processed Raman spectra with second derivatives thereof and the percentage of secondary structure components (Figure 1). The Raman spectra for MAb A and MAb B appeared practically identical, as did the second derivatives of those spectra overlaid atop one another across the 600–1,800 cm–1 spectral region. In addition, the deconvoluted percentage of secondary-structure components were in good agreement with each other. Taken together, these data strongly suggest that MAb A and MAb B are highly similar in their secondary and tertiary structure.
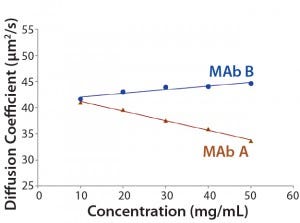
Figure 2: The kD of MAbs A and B from dynamic light scattering (DLS) of concentration series
Dynamic Light Scattering Comparisons: However, DLS results indicated that the hydrodynamic size and kD (Figure 2) were actually different for MAb A and MAb B. As extrapolated from a plotting against protein concentration, their hydrodynamic radii (Rh) were 5.89 and 6.08 nm for MAb A and MAb B, respectively. That difference was more significant at higher concentrations (Figure 3). For instance, the apparent Rh values at 50 mg/mL were 7.81 and 5.80 nm for MAb A and MAb B, respectively. Even after we corrected the bulk solution viscosity (1), such differences remained. Thus, the different kD values (1.67 for MAb B and –4.30 for MAb A) suggest that the intermolecular interactions are repulsive for MAb B and attractive for MAb A. Based on that difference, MAb B would be expected to demonstrate increased colloidal stability relative to MAb A.
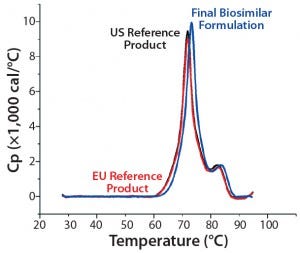
Figure 3: DSC profiles for MAbs A and B
In addition, we found that conformational stability of MAb B was slightly better than MAb A, as measured by DSC (Figure 3). The Tonset and Tm1 values for the former were ~2.5 °C higher than those determined for the latter (a reference product sourced from US and EU markets). DSC often is performed on diluted protein solutions (typically <2 mg/mL) and hence cannot indicate conformational stability at typical drug-product concentrations. The DLS-coupled Raman spectroscopy approach that measures a change in higher-order structure as a result of temperature stress can be ideal for predicting conformational stability of therapeutic proteins at pharmaceutically relevant concentrations and formulation conditions.
We attribute the better conformational and colloidal stability of MAb B to a change in formulation composition that was a result of our extensive buffer, excipient, and stabilizer screening (1). Furthermore, such a change in formulation composition of biosimilar drug products is both permitted and acceptable based on recently published regulatory guidance (2).

Figure 4A: Overlay of Raman spectra for MAb A (left panel) and MAb B (right panel) at indicated temperatures along thermal ramping study from 20 °C to 90 °C
Thermal Ramping — Conformation and Size: By performing a temperature ramping study, we evaluated the overall thermal stability of two MAb samples at formulated conditions (Figures 4A and 4B). Both DLS data and Raman spectra suggest that MAb B possesses a higher transition temperature than MAb A (69 °C and 65 °C, respectively).
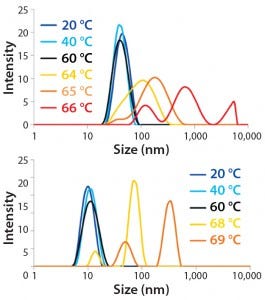
Figure 4B: Overlay of DLS size distributions for MAb A (top panel) and MAb B (bottom panel) at indicated temperatures along thermal ramping study from 20 °C to 90 °C
For the size distribution at 64 °C, MAb A had an apparent radius of 14.55 nm with a polydispersity index (PDI) of 0.212, whereas MAb B’s apparent radius was 6.41 nm with a PDI of 0.198. Furthermore, temperatures for the final DLS measurements at reasonable size correlation appeared to be at 65 °C (MAb A) and 68 °C (MAb B). That observation also was consistent with the temperature for decent Raman spectral subtraction. Taken together, these results support our conclusion that upon thermal stress, MAb B demonstrates higher stability than MAb A in terms of both structure and size.
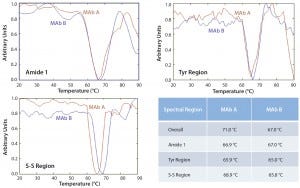
Figure 5: Overlay of principal component analysis (PCA) score 2 of Raman spectra for MAbs A and B at indicated temperatures along thermal ramping study from 20 °C to 90 °C
Beyond the transition temperatures, massive aggregation prevented our obtaining meaningful Raman spectral data for detailed structural comparisons. Thus, we applied principle component analysis to compare the different transition temperatures (if any) for MAb A and MAb B. As Figure 5 shows, the overall spectral features indicate that MAb B (Ttran 71 °C) is more stable than MAb A (Ttran 67 °C). However, we saw no such significant difference in either the Amide I or Tyr regions, typical representations of secondary and tertiary structure, respectively. The major spectral difference seems to be in the disulfide bond region, for which the transition temperatures were 68.9 °C (MAb B) and 65.8 °C (MAb A). These observations suggest that under temperature-stress conditions, the overall secondary and tertiary structure of both antibodies do not change or differ significantly in either their Amide I or Tyr regions. However, changes occurred in the S–S region at a higher temperature for MAb B than for MAb A, indicating improved stability for the former.
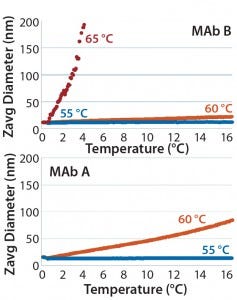
Figure 6: DLS of MAb B (top panel) and MAb A (bottom panel) upon isothermal incubation at indicated temperatures: 55 °C, 60 °C, and 65 °C
Isothermal Incubation — Conformation and Size: Although temperature ramping distinguished the thermal stability of MAb A and MAb B, we applied isothermal incubation close to melting temperatures in an attempt to correlate structural changes with aggregation kinetics. This approach could be more meaningful for our understanding of product stability over long-term storage. As Figure 6 shows, the Z-average diameter for both MAbs A and B remained constant with practically no slope after a 10-hour incubation at 55 °C. However, after incubation at 60 °C, the Z-average diameter increased in both samples, but the rate of increase for MAb B was less than that for MAb A. At an even higher temperature of 65 °C, the Z-average diameter quickly increased for both MAbs as a result of aggregation. A few points could be measured for MAb B up to four hours; for MAb A, severe aggregation occurred immediately so no size measurements could be performed. Based on those differences in Z-average diameter at elevated temperatures, MAb B appeared to be more stable than MAb A.
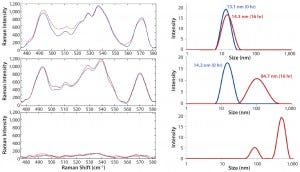
Figure 7: Raman spectra in disulfide region (left panel) and corresponding size distribution of MAb A (right panel) upon isothermal incubation at indicated temperatures: 55 °C, 60 °C, and 65 °C
To further probe the relationship between aggregation and structural features in the disulfide bond region, we aligned the DLS size distribution and corresponding Raman spectra side by side for comparison. Figure 7 reveals a significant size change for MAb A at 55 °C and 60 °C; however, the disulfide bond region of the spectrum did not change accordingly. At 65 °C, larger aggregates formed so that no Raman spectra or DLS scattering of sufficient quality could be obtained. By contrast, MAb B showed different aggregation and spectral features. At 55 °C, MAb B increased in size from 10.1 to 11.4 nm (Figure 8), whereas MAb A increased from 13.1 to 14.3 nm (Figure 7).
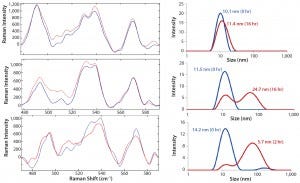
Figure 8: Raman spectra in disulfide region (left panel) and corresponding size distribution of MAb B (right panel) upon isothermal incubation at indicated temperatures: 55 °C, 60 °C, and 65 °C
The disulfide bond region of the spectra were similar for both antibodies, especially the peak intensity ratio of 540 to
525 cm–1. At 60 °C, MAb B also aggregated; however, its measured size was 24.7 nm (compared with 84.7 nm for MAb A). At the same time, MAb B retained a significant population at 11.5 nm. Finally, at 65 °C, its size increased to 55.7 nm, with a remaining small intensity contribution from size ~14.2 nm. We found it interesting that the disulfide bond peak intensity at 525 cm–1 actually decreased at that condition with the incubation time. To further understand these structural features and their role in aggregation, we would need to perform additional studies. Under formulated conditions, however, the above-described correlation of structural features with aggregation clearly demonstrated that MAb B had higher thermal stability than MAb A. Additionally, we identified specific regions for further investigation.
Better Characterization for Comparison
Characterization of protein thermal stability usually is conducted at low protein concentrations. For biosimilar product evaluations and comparability,
however, better characterization and assessment of protein stability at the final formulated conditions (50 mg/mL protein concentration, same molar ratios of buffer, excipients, and protein as in the formulation, with no sample dilution) are crucial. In this case study, our results not only demonstrated that MAb B was more thermally stable than MAb A — both colloidally and conformationally — but also revealed different responses in the disulfide bond region to isothermal incubation while correlating those to aggregation. We believe that combining Raman spectroscopy with DLS offers unique insights to better characterize biosimilar therapeutics at pharmaceutically relevant concentrations and conditions.
Acknowledgments
We acknowledge and thank Kevin Mattison, PhD (principal scientist, bioanalytics, at Malvern Instruments) and Scott Gangloff (senior vice president, process development and manufacturing, Oncobiologics Inc.) for critical review and scientific advice.
References
1 Mattison K, et al. Unpublished results, 2016.
2 CBER/CDER. Scientific Considerations in Demonstrating Biosimilarity to a Reference Product: Guidance for Industry. US Food and Drug Administration: Rockville, MD, April 2015; www.fda.gov/downloads/DrugsGuidanceComplianceRegulatoryInformation/Guidances/UCM291128.pdf.
Wei Qi, PhD, is a senior scientist; and corresponding author Stacy Kenyon, PhD, is a scientist in the Bioscience Development Initiative at Malvern Instruments Ltd., Enigma Business Park, Grovewood Road, Malvern, Worcestershire, WR14 1XZ, UK; 44-1684-892456, fax 44-1684-892789; stacy. [email protected]; www.malvern.com. Maria Taddei is a senior scientist II; Jessica Cheung is a scientist II; and corresponding author Hiten Gutka, PhD, is a principal scientist in formulation development at Oncobiologics Inc., 7 Clarke Drive, Cranbury, NJ 08512; 1-609-619-3990 x225, fax 1-609619-3980; [email protected]; www.oncobiologics.com.
You May Also Like


