Higher-Order Structure Comparison of Proteins Derived from Different Clones or ProcessesHigher-Order Structure Comparison of Proteins Derived from Different Clones or Processes
September 1, 2008
Biological product manufacture is a complex process that constantly evolves throughout the lifecycle of each product even after its approval. A number of constraints (such as increased yield, scale-up, or a need for greater purity) can necessitate the redesign or optimization of a given process. Heterogeneity of a biopharmaceutical product at the beginning of its shelf life comes from inherent variations in its production process that lead to various forms of posttranslational modifications and degradation products.
Clearly, the foremost aim of designing or optimizing a production process is obtaining a maximum yield while maintaining high product purity through minimization of degradation forms and product heterogeneity. However, changes in a production process may create the need for comparability assessment to ensure that a consistent pattern of critical quality parameters is obtained — and thus safety, purity, and efficacy of the product are uncompromised. Such an assessment entails a comprehensive set of common analytical techniques that probe different, specific quality attributes (1).
PRODUCT FOCUS: RECOMBINANT PROTEINS
PROCESS FOCUS: PRODUCTION
WHO SHOULD READ: PRODUCT AND PROCESS DEVELOPMENT, QA/QC, AND ANALYTICAL PERSONNEL
KEYWORDS: ANALYTICAL METHODS, DATA MANAGEMENT, COMPARABILITY, DECONVOLUTION
LEVEL: ADVANCED
Methods that are commonly used in biopharmaceutical quality control and characterisation for analyzing the higher-order structure of proteins (their secondary and tertiary structure) include circular dichroism (CD) and infrared (IR) spectroscopy. These techniques are extensively reviewed elsewhere (2,–3). We focus on the use of CD spectroscopy for higher-order structure comparison of proteins — in particular the difficulties associated with objectively comparing and evaluating spectral data. We propose a statistical approach that facilitates the definition of unequivocal acceptance criteria for spectra assessment. This approach eliminates user bias associated with visual examination of spectra and therefore allows more objective assessment.
Results and Discussion
CD spectra are often examined visually by overlaying a sample with a reference spectrum. Equality is thus judged visually by the degree of resemblance of the spectra, so an analyst assessing such data can inherently bias the results. Consequently, depending on the experience of the operators involved, the outcome of each analysis (acceptance or rejection of a sample) may be judged differently.

Figure 1:
WWW.PHOTOS.COM
One way to eliminate operator bias associated with visual assessment of spectra could be deconvolution, a process often used for far-ultraviolet (UV) CD spectra to extract quantitative data regarding secondary structure (e.g., percentages of helices, sheets, and turns). Deconvolution procedures are based on datasets of solved X-ray structures comprising various fold types and widely used algorithms that include multilinear regression, ridge regression (CONTIN software), singular value decomposition, variable selection (VARSLC software), the self-consistent method (SELCON software), and neural networks (CDNN and K2D software) (4). Nevertheless, these approaches apply only to the far-UV spectrum (the secondary structure information). Outcomes of such analyses (secondary structure percentages) depend greatly on the reference database used.
Table 1 shows secondary structure content results of the same sample of a viral envelope protein, deconvoluted with the neural network algorithm CDNN (5) and involving three different base-spectra sets included in the downloadable CDNN software package. The percentages obtained for helical and sheet content (antiparallel and parallel) are seen to vary substantially. Although consistently processing both sample and reference data would produce a set of numeric values on which equality could be assessed — provided that limits or specifications were established — it is apparent that such percentages do not necessarily reflect the real, mostly unknown values for a given protein.
Table 1: Secondary structure prediction by CDNN (5) using different base spectra sets; the same far-ultraviolet CD spectrum of a glycosylated viral envelope protein was used.

Table 1: Secondary structure prediction by CDNN (5) using different base spectra sets; the same far-ultraviolet CD spectrum of a glycosylated viral envelope protein was used. ()
When spectra are visually compared, the problem of operator bias frequently arises from the difficulty of distinguishing experimental variations from genuine structural differences. For example, Figure 1 shows a typical overlay of near-UV spectra for different batches of the same protein. When assessing the equality of these samples, an analyst must judge whether any spectral differences reflect structural differences — or whether they may be attributable to different kinds of variations, such as instrument-related noise, “normal” batch-to-batch process variation, or differences in sample preparation (e.g., dilution).
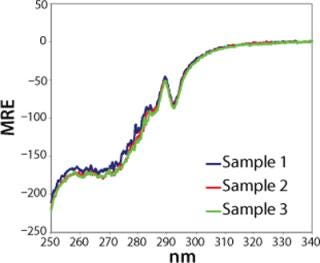
Figure 1: ()
Our Method: To elucidate the impact of different sources of variation on the variability of raw CD spectra, we recorded repeated measurements of a given protein under different experimental conditions (Figure 2). To highlight instrumentrelated variation alone, a sample was consecutively measured without removing the cuvette from the CD instrument. Repeated measurements of different batches revealed some batch-to-batch variability. We assessed day-to-day variation by repeatedly measuring the same dilution of a given batch on different days. Variation that was attributable to sample preparation was revealed by repeatedly preparing and measuring the samples of the same batch.
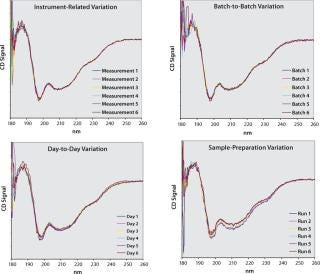
Figure 2: ()
Obviously, the different sources of variation cannot be completely uncoupled from one another. For example, all our experiments encompass instrument-related variation, and analyzing samples from different batches (batch-to-batch variation) inevitably requires sample preparation. Nevertheless, the extent with which individual measurements within a graph spread provides a qualitative indication of how strongly a particular source affects obtained spectra. It can be seen that variation among individual measurements increases in the following order: instrument-related to batch-to-batch effects to day-to-day variation to sample preparation.
The spread of replicate or consecutive measurements reflects the overall variation associated with a particular set of data. Based on that observation, we propose an approach hereafter referred to as quantitative CD, which allows defining acceptance criteria that eliminate operator bias. Instead of using a single spectrum as a reference, we calculate an averaged mean spectrum from replicate measurements, together with minimum and maximum boundaries based on the standard deviations at each data point (Figure 3). This way, the amount of variation from various sources in each dataset can be taken into account quantitatively, so genuine spectral differences can be reliably distinguished.
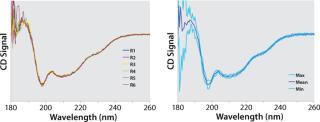
Figure 3: ()
For example, in comparability studies (e.g., comparing a new and old process) a reference spectrum is calculated from a certain number of different batches that are representative of the reference process. In such a case, the minimum (Min) and maximum (Max) boundaries reflect batch-to-batch variability of the original process as well as contributions from sample preparation and instrumental noise. A sample lying within those boundaries is therefore indistinguishable from other spectra of the reference set and can therefore be considered comparable.
Materials and Methods
The CD spectra of the model glycoprotein employed were collected on a Jasco-810 spectropolarimeter at room temperature. The following parameters were employed.
Near UV spectra: path length 1 cm, protein concentration about 27 µmol/L, wavelength range 340–250 nm, data pitch 0.2 nm, bandwidth 1.0 nm, response 4 sec, scan speed 10 nm/sec, three accumulations
Far UV spectra: path length 0.1 cm, protein concentration about 9 µmol/L, wavelength range 260–180 nm, data pitch 0.5 nm, bandwidth 1.0 nm, response 4 sec, scan speed 10 nm/sec, three accumulations
Spreadsheet Calculations: To facilitate the practical application of our quantitative CD approach, we constructed a customized Microsoft Excel spreadsheet with normalized reference and sample spectra inserted. Normalization is necessary for concentration dependence of a CD signal and can be achieved by, for example, calculating the mean residue ellipticity (MRE), which is the most commonly reported CD unit, or by simply dividing an instrument’s CD signal at each measured wavelength by the sample’s protein concentration. Our spreadsheet then automatically calculates an averaged mean spectrum and the standard deviation at each wavelength. The Min/Max envelope is constructed automatically from a selectable multiple of the standard deviation.
Our spreadsheet generates for normalized sample-spectra graphical overlays with the reference spectrum (Mean). Figure 4 shows an application example of this approach. The figure represents data from a comparability study for a recombinant therapeutic protein, comparing samples from a serum-free production process (sample) with a mean reference spectrum constructed using several batches from the previous, serum-supplemented reference process. In this example, the Min and Max spectra were representative of three times the standard deviation at each measured wavelength, so they serve as an acceptance range. Deviations of the sample spectrum from the reference spectrum (the difference between the sample signal and reference) are calculated at each measured data point (wavelength). This difference in signal is then divided by the standard deviation at each data point and graphically displayed in the lower traces of Figure 4.
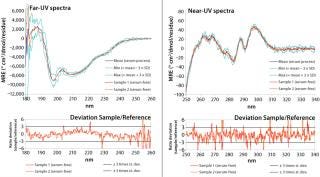
Figure 4: ()
Furthermore, the spreadsheet automatically verifies whether certain acceptance criteria are met. A sample spectrum is considered to be acceptable if it lies within the acceptance range (e.g., mean signal ± 3 × SD) and if local deviations from that acceptance range (data points above the Max or below the Min spectrum) do not occur over a wavelength range (x-axis) that is greater than 3 nm.
That second criterion was deemed necessary because it was found that the standard deviation is not uniform across the measured spectrum (Figure 5) and that several wavelengths can be found at which it is almost nil. Consequently, dividing a sample’s deviation from its mean by an infinitesimal SD value inevitably leads to relatively large isolated deviations from the acceptance range. However, it can be reasonably assumed that spectral features in circular dichroism of proteins are generally wider than the allowed deviation of 3 nm. Thus, such local deviations can be attributed to experimental noise rather than conformational differences. We are currently developing an alternative approach to overcoming the need for this criterion based on smoothing of Max/Min standard deviation spectra.
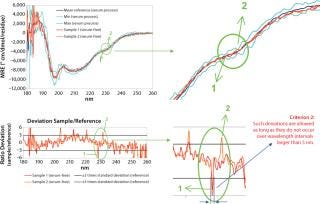
Figure 5: ()
Our Conclusions
Circular dichroism is an established characterization technique that can be successfully used in biopharmaceutical process development for detecting conformational changes or assessing comparability of test samples with references. Equality of spectra can be assessed either visually or by spectral deconvolution, extracting from the spectra a set of numerical values that represent the secondary structure content of a given protein. Visual assessment is inevitably subject to operator bias, and commonly used deconvolution methods merely exploit the information content of the far-UV region.
So we propose an approach for spectra comparison based on statistical analysis of reference data rather than visual inspection. The advantages of this approach are
Elimination of operator bias in judging the correspondence of a sample and reference
Generation of reference spectra that are reusable for future measurements
Easy adaptation to analyzing data obtained from other techniques
Flexible design of reference spectra that can incorporate various sources of variation (e.g., batch-to-batch, day-to-day, sample preparation), so analyses can be tailored to specific needs.
We successfully applied this approach to demonstrate comparability of drug substance samples produced by a serum-free process (sample) with those of an original serum-based process (reference).
REFERENCES
1.) Chirino, AJ, and A. Mire-Sluis. 2004. Characterizing Biological Products and Assessing Comparability Following Manufacturing Changes. Nat. Biotechnol. 22:1383-1391.
2.) Kelly, SM, TJ Jess, and NC. Price. 2005. How to Study Proteins By Circular Dichroism. Biochim. Biophys. Acta 1751:119-139.
3.) Haris, PI, and D. Chapman. 1995. The Conformational Analysis of Peptides Using Fourier Transform IR Spectroscopy. Biopolymers 37:251-263.
4.) Sreerama, N, and RW. Woody. 2004. Computation and Analysis of Protein Circular Dichroism Spectra. Methods Enzymol. 383:318-351.
5.) Böhm, G, R Muhr, and R. Jaenicke. 1992. Quantitative Analysis of Protein Far UV Circular Dichroism Spectra By Neural Networks. Protein Eng. 5:191-195.
You May Also Like


