A Case Study in Environmental Monitoring: Reviewing Incubation Times Upon Recovery of MicroorganismsA Case Study in Environmental Monitoring: Reviewing Incubation Times Upon Recovery of Microorganisms
March 21, 2023
Environmental monitoring (EM) remains an essential detection tool for cleanrooms within healthcare and pharmaceutical-manufacturing facilities. During monitoring, an agar growth medium is incubated at a specific temperature for a set time. There is no single approach to incubation. Researchers have performed several EM incubation studies, with results reflecting a diversity of practice. Typically, biomanufacturing sites either run selective monitoring sessions using single-incubation regimes with two different culture media, or they leverage a dual-incubation system using two temperature ranges with a single agar plate transferred between them. The latter strategy involves some compromise over what types of microorganisms can be recovered (1). But that concern is balanced by cost savings and avoidance of cross-contamination risks that can arise from doubling the number of needed interventions, such as into the aseptic core of grade A environments. With both approaches, the rationale is that higher temperatures are required for bacterial recovery (e.g., 30–35 °C) than for recovery of fungi, which typically thrive at lower temperatures (e.g., 20–25 °C). In other cases, pharmaceutical manufacturers have used one incubation regime with one culture medium (2, 3). At many facilities, the incubation regime practiced stems from historical preference, although some microbiology departments have sought to select an optimal regime based on experimentation.
With dual-incubation regimes, a key variation in practice concerns the starting temperature and order of incubation. Moving from higher to lower temperatures can inhibit the growth of fungal contamination, not only because fungal growth is optimized at low temperatures, but also because high temperatures could damage the lytic cellular enzymes that fungi need for their growth. However, starting at the low temperature can result in a loss of viability of organisms that grow more effectively at higher temperatures (e.g., bacteria). In practice, most dual-incubation regimes run from low to high temperature.
Below, I present a study that was designed to determine whether a dual-incubation regime could be shortened without significantly altering microorganism recovery. A preexisting dual-incubation regime served as my team’s starting point, and no protocol was presumed to be superior to others. My goals herein are to assess how an existing regime might be altered, describe the study, and offer the process as a benchmark for others who are interested in performing similar investigations.
The study included both in vivo (laboratory) and in situ (environmental) experiments. Whereas in vivo testing enables control over inoculum levels and provides for some reproducibility (4), in situ testing is important given that microorganisms isolated from a cleanroom environment can behave differently than those cultured in a laboratory. Microorganisms that are isolated from a cleanroom — or from any environment — can exhibit stress from competition for nutrients, resulting in growth suppression. Known as the Jameson effect, that inhibition mechanism is defined as competition among species to use resources available within the environment to optimize growth (5). Growth stops when all resources are depleted. Hence, stressed microorganisms often show a longer lag phase and take longer to grow, affecting their response times during culture.
Experimental biases and errors influence all scientific studies. EM methods differ in their application, and limitations surround their metrological accuracy. In addition, many microorganisms from the environment cannot be cultured. That could be true across an entire set of studies — e.g., because of the agar used. More problematic, select experiments could be affected. For instance, target microbes might be unculturable only during certain physiological states (6). Culturable microorganisms also grow at different temperatures. The study described herein focuses on mesophiles, microorganisms that are associated with the inside and outside of the human body. Such microbes typically grow between 20 °C and 40 °C (7), and they generally pose the greatest concerns for cleanrooms because people are the predominant cause of contamination within such environments (8).
Cultures were based on tryptone soya agar (TSA), which is equivalent to soya-bean casein-digest medium. TSA is used widely in EM as a general recovery medium (9). The study’s focus was on surface samples using a contact-plate method. Thus, the TSA media contained an agent that is known to neutralize disinfectant residues effectively.
Experimental Goals and Methods
The study’s purpose was to determine whether incubation duration and temperature significantly influence how many microorganisms are recovered from a cleanroom during EM. My team sought to generate data showing optimal growth conditions for microorganisms isolated from the cleanroom (in situ) and in the laboratory (in vitro), incubated at single temperatures. Those data would be used to determine whether a new, shorter dual-incubation regime yielded results comparable with what could be gathered by my company’s established regime, which calls for five days of incubation at 20–25 °C and two days at 30–35 °C (10). The study involves some inferences about single and dual incubation; however, the focus was to set out a methodology that could be considered if shortening an incubation regime proved to be feasible.
The study comprised two phases, the first of which was designed to identify optimum incubation times for microorganisms cultured at 20–25 °C or 30–35 °C for a maximum of 15 days. A third set of samples was incubated according to the dual-incubation regime currently in place at our company’s facility (incubation for at least five days at 20–25 °C and for at least two days at 30–35 °C).
We analyzed results from the single-incubation studies to determine optimum incubation times for each temperature range. Optimum incubation times were defined as periods during which no significant differences were observed between daily colony counts recorded for each temperature range. Then, we combined those parameters to create a new dual-incubation strategy (hereafter called the test incubation regime). Phase 2 of the study involved comparison of the test and established incubation regimes. Both phases included testing of typed cultures (in vitro experiments) and field trials (in situ studies) whereby environmental samples were collected from a selection of cleanrooms within the facility.
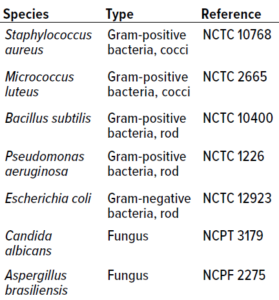
Table 1: Microorganisms used for in vitro experiments.
Microorganism Selection: Type-culture microorganisms for in vitro studies were selected to account for a breadth of microbes that often are isolated from cleanroom environments of different classes. Table 1 lists cultures used in both study phases.
Phase 1 Methods — In Vitro Testing: Each type culture was prepared using a 1-mL aliquot dispensed onto the center of a 25-cm² plate coated in TSA. The target inocula were 10–100 colony forming units (CFU). Ten replicates were created for each cultured microorganism, and we prepared samples in triplicate to test material in all three incubation regimes. Our choice of 15 days maximum incubation time was arbitrary. In practice, it is unlikely for EM to require incubation of plates for such a period because results would come in too long after sampling, limiting the benefit of remedial action.
Phase 1 Methods — In Situ Testing: We selected four EU good manufacturing practice (GMP) grade C (ISO 14644 class 8) cleanrooms for monitoring. Those rooms enabled higher recovery levels compared with areas of higher grades. Samples for surface-contact plates were taken at predefined locations, including floors, walls, and working-height surfaces. Samples were taken in triplicate to account for all three incubation regimes. Given the nature of surface sampling, material could not be collected from exactly the same location each time; rather, subsequent samples were taken as close as possible to the previous sites of collection. Hence, some variability in the data is unavoidable.
Selected sampling areas included a changing room, a corridor, and two processing areas. Surfaces sampled were typically vinyl flooring or stainless-steel materials. Ten samples were collected in triplicate from each cleanroom (a total of 120 samples). Following incubation, daily plate counting was performed using a colony counter equipped with a white light source and a magnifying lens.
Phase 2 Methods — In Vitro Testing: Type cultures were prepared in replicates of 10, in duplicate to account for the two conditions under examination. Samples were incubated according to the test incubation regime (20–25 °C for four days and 30–35 °C for two days) or the established protocol (20–25 °C for five days and 30–35 °C for two days). Materials underwent the same preparation as during study phase 1.
Phase 2 Methods — In Situ Testing: This part of the study used samples collected from 17 cleanrooms with different sizes, applications, and environmental conditions:
• three grade C process rooms
• three grade D process rooms
• two grade C cold rooms
• four grade C corridors
• two grade D wetrooms (with drains)
• three grade C change areas.
Five sets of duplicate samples were collected in each room. Three sets came from floor areas (from the middle, left, and right of the room). Two sets came from working-height surfaces (from walls on the left and right sides of the room).
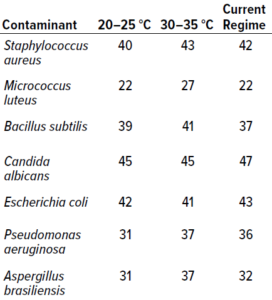
Table 2: Results from study phase 1; values below represent the highest counts recorded across 10 replicates for a particular microorganism (expressed as colony-forming units, CFU). Columns 2 and 3 present data from single-incubation regimes performed at the specified temperatures. The final column lists data from experiments using an established dual-incubation regime (six days at 20–25 °C and three days at 30–35 °C).
Phase 1 Results
In Vitro Testing: Table 2 presents the highest count recorded at each temperature for each microorganism. The single-incubation regime set at 30–35 °C generated the highest number of colony recoveries for both bacteria and fungi. It is unsurprising that Aspergillus brasiliensis showed better recoveries at the higher temperature range than did other fungal species: As a human pathogen, A. brasiliensis is well suited to temperatures close to that of the human body. For the single-incubation tests, most colonies were recovered by day two of incubation at 30–35 °C and by day four at 20–25 °C. In terms of colonies recovered, no significant differences were observed between results from the 20–25 °C single-incubation protocol and the established dual-incubation strategy.
We used statistical analysis to determine whether such differences had occurred. With an unpaired Student’s t-test (using a 0.05 level of significance and a 95% confidence level), we calculated differences among day-to-day results from both incubation regimes. The t-table distribution using a 0.05 level of significance for 210 samples equals 2.228.
Data were analyzed daily. We compared counts from day one with those from day two, values for day two were compared with data from day three, and so on. Table 3 provides t-test values for Staphylococcus aureus. Values listed in red (>2.228) represent statistically significant differences. Green-colored values fall <2.228, indicating no significant differences.

Table 3: Results of a Student’s t-test for Staphylococcus aureus data from study phase 1 (0.05 level of significance, 95% confidence level); the current dual-incubation strategy calls for six days of incubation at 20–25 °C and three days at 30–35 °C. Values in red are greater than the threshold of 2.228 and thus represent significant differences; values in green are below the threshold, indicating no statistically significant differences.
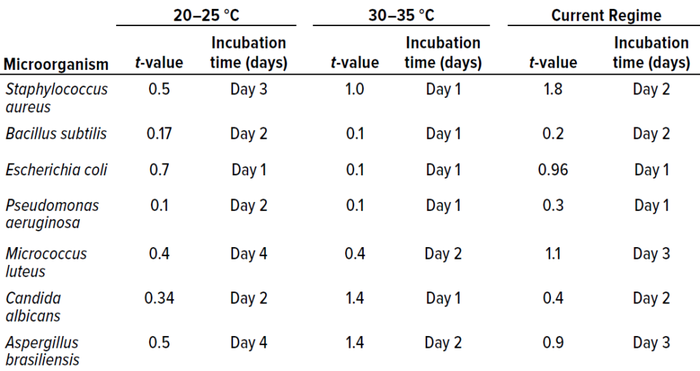
Table 4: Student t-test results and incubation duration (in days) from in vitro experiments for study phase 1 (0.05 level of significance, 95% confidence level).
We used that approach for all cultured microorganisms. Table 4 summarizes the results. Column 1 shows t-values for the 20–25 °C temperature range. No significant differences appeared. Column 2 shows the representative day of incubation to which that t-value applies. The day listed corresponds with the shortest incubation period (the first day on which no significant difference was observed between counts).
Those results indicate that
• for the 20–25 °C temperature range, four days of incubation are required for optimum growth of most samples
• at 30–35 °C, two days are required for optimum growth of most samples
• the established dual-incubation regime requires three days for optimum growth of most samples.
There is a slight difference (of one day) between colony recoveries from the established dual-incubation regime and the single-incubation regime at 20–25 °C, suggesting that the latter strategy performed better than the established dual-incubation regime. The reason for this result is unknown, but it is within an accepted margin of error.
Results from the in vitro experiments indicate that bacteria should be incubated for three days at 20–25 °C and for two days at 30–35 °C. Fungi should incubate for four days at 20–25 °C and for two days at 30–35 °C. In a dual-incubation regime, those parameters should produce the best outcomes for the microorganisms tested in phase 1 (for in vitro study only). Testing revealed differences between bacterial and fungal growth rates. Because fungi required longer incubation, that factor should be incorporated into the test dual-incubation regime.

Table 5: Results from in situ testing during study phase 1; the values below represent the numbers of samples that achieved the highest number of recovered colonies (expressed as colony-forming units, CFU).
In Situ Testing: Table 5 shows the numbers of samples from which the highest number of colonies were recovered at each temperature. In total, 28 samples showed growth, whereas 12 recovered no contamination. The results reveal that the highest recovery of CFU occurred at 30–35 °C, with 14 samples out of 28 showing the largest possible numbers of microorganisms.
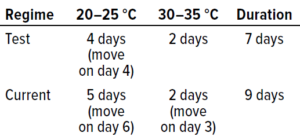
Table 6: Summary of incubation regimes tested in study phase 2.
At 20–25 °C, 50% of samples showed the largest number of colonies recovered by day four. Note that 20% of samples recovered the largest number of colonies after day five. Contamination recovered beyond day five typically was fungal. At 30–35 °C, 51% of samples showed the largest number of colonies recovered by day two. In the established dual-incubation regime, 57% of samples showed the largest number of colonies recovered by day five. Of the 40 samples collected, 12 had no microbial growth across all temperatures. The highest recovery was recorded during the 30–35 °C single-incubation regime; the lowest occurred during the dual-incubation regime.
Furthermore, most samples incubated at 30–35 °C recovered their highest counts after day two of testing. At 20–25 °C, the majority of samples showed the highest recoveries on day four. Using the established dual-incubation strategy, with the highest recoveries recorded on day four.
Those results reveal the ideal dual-incubation protocol to be four days at 20–25 °C and two days at 30–35 °C. Data from our in situ experiments support findings from the in vitro testing.
Phase 2 Results
In Vitro Testing: Data collected during the first phase formed the basis of our test dual-incubation regime for the second phase. We compared mean results for cultured microorganisms from both incubation regimes, applying an unpaired Student’s t-test (0.05 level of significance, 95% confidence level) to ascertain whether significant differences emerged between results. The cut-off t-value, which applies a 0.05 level of significance for 10 samples, is 3.250.
Table 7 shows that most cultured microorganisms were recovered more effectively from the test incubation regime than from the established protocol. However, results were not significantly different.
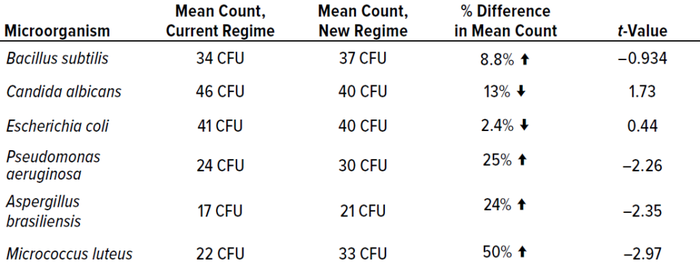
Table 7: Mean results from phase 2 experiments for each microorganism, including t-value data; CFU = colony-forming units.
Table 8 compares all incubation regimes performed for the in vitro experiments, showing the highest number of colonies recovered from 10 replicates of each microorganism.
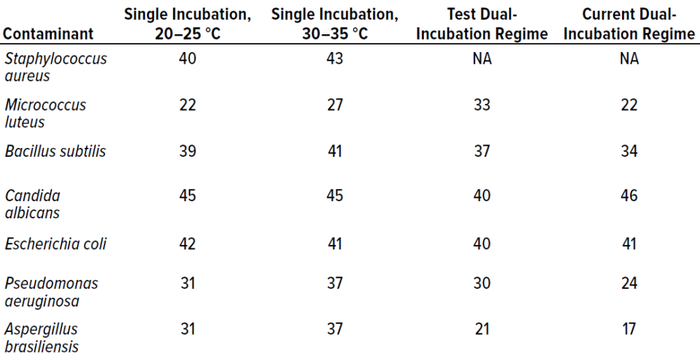
Table 8: Comparison of all incubation regimes, showing the highest count recorded (expressed as colony-forming units, CFU) for each microorganism at each temperature.
In terms of colonies recovered, the best-performing condition was single incubation at 30–35 °C, probably because the majority of test microorganisms are bacteria, which favor higher temperatures. Candida albicans recoveries were higher from the established dual-incubation regime than from the test protocol, and Escherichia coli was recovered at higher levels during single incubation at 20–25 °C. However, recoveries were not statistically different between incubation regimes.
The data indicate no significant differences in the number of colonies recovered during in vitro testing across all incubation regimes following a defined period.
In Situ Testing: Table 9 summarizes results from in situ comparison of the test and established dual-incubation regimes, listing how many samples recorded the highest number of colonies, how many samples showed no growth, and how many samples recovered a “spreading” (overgrowing) microorganism.

Table 9: Summary of results from in situ experiments during study phase 2.
The test regime generated more samples showing the highest colony recoveries than did the established incubation regime; however, differences among the samples were insignificant. The test incubation strategy also recorded the highest average counts. Of interest is that, for both incubation conditions, the transfer between temperature conditions did not change the number of colonies recovered.
We performed an unpaired Student’s t-test (0.05 level of significance, 95% confidence level) to determine whether differences in the data were statistically significant. Because the data were not evenly distributed, we calculated their square roots and used those in the t-test. The t-table distribution using a 0.05 level of significance for 85 samples is 2.66. We calculated a value <2.66 (0.54), indicating that the two incubation regimes showed no statistically significant differences. Therefore, our established incubation regime could be shortened without adversely affecting colony counts.
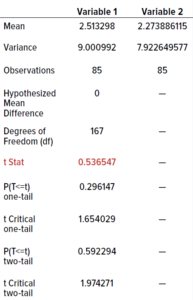
Table 10: Outcomes from t-tests; the value in red is less than the threshold of 2.66, indicating no statistically significant differences between results from the test and current dual-incubation regimes.
Discussion
Variations can arise between isolates recovered from the environment and those cultured in a laboratory. Thus, running experiments with both types of samples was sensible. Data from study phase 2 showed no significant differences in the numbers of microorganisms recovered between the test (seven days) and established (nine days) dual-incubation regimes, as performed at my team’s facility. This result makes a case for reducing the incubation time of our protocol, assuming that a dual-incubation regime continues to be desirable.
The intent behind dual incubation is to ensure that bacteria and fungi can be appropriately cultured from the sampled environment. When reviewing data from phase 2, we found no significant changes in counts when the temperature was increased from 20–25 °C to 30–35 °C. We inferred that the change did not encourage growth of organisms that were unable to grow at the lower temperature range. That might suggest that dual incubation is of little benefit regarding colony recovery from samples for microorganisms that typically are associated with pharmaceutical-manufacturing environments. However, that concern might be a consequence of a small data set and of the low levels of fungi present within the cleanrooms sampled. Further research based on a larger sample set is needed to support or refute any such conclusions. Readers also should consider differences in geography and climate, which can alter the type and pervasiveness of fungi that present risks to a cleanroom environment.
It is often presumed that fungal contamination grows more favorably at temperatures of 20–25 °C than at 30–35 °C (10). My team’s study used cultured fungal isolates: A. brasiliensis (a filamentous fungus) and C. albicans (yeast, with dimorphic morphology). During our study, both organisms grew more at the higher temperature range, achieving the highest number of recovered colonies by day two of testing. A. brasiliensis and C. albicans are human pathogens, so it is unsurprising that they are well suited to the higher temperature, which is closer to that of the human body. However, other fungi might grow more effectively at lower temperatures. That possibility represents a limitation of this study for assessment of fungi (11).
A particular shortcoming of our phase 1 experiments was that the cultured microorganisms did not include a broader selection of fungal isolates, such as Cladosporium species and other such fungi associated with cleanrooms and other “as-built” environments (12). During in situ experiments, such isolates were recovered, albeit in low numbers. Among those organisms were species of Cladosporium and Geomyces, which were recovered on day five at 20–25 °C and by day three at 30–35 °C. A more comprehensive study would be required to provide evidence that those fungal species are capable of being regularly cultured from the environment (if present) at a single temperature. The same goes for bacteria, provided that the incubation regime lasts for longer than three days.
The goal of our study was not to query the value of a dual-incubation regime, but rather to consider the length of time required for such protocols. Analyses from single-incubation experiments found that incubation at 30–35 °C recovered the majority of colonies within two days. At the lower temperature range, most colonies were recovered by day four of incubation, the inference being that colonies can be recovered over a shorter duration at the higher temperature.
An alternative to using conventional agar and incubation regimes is to implement rapid microbiological methods. Several newly available technologies can decrease time to results, including systems for growth-based methods that measure biochemical or physiological activity (using a fluorescent staining) and blue-light–emitting diodes that scan for “microcolonies,” thereby detecting growth more rapidly.
Successful Programs for Environmental Monitoring
The purpose of this study was to determine whether incubation time has a significant impact on the number of microorganisms that can be recovered across two different temperature ranges during EM. Although the data did not reveal an optimum incubation regime that yielded significantly higher or lower numbers of colonies, our findings show how incubation-time reductions can be made. We found that the test and established incubation regimes generated no significant differences in numbers of colonies recovered. Therefore, a shorter incubation time might be beneficial for a dual-incubation protocol if scientists need to accelerate time to results.
For both temperature ranges, the optimum number of colonies was recovered by the fourth day of incubation, assuming that the optimum duration is no less than four days. Few colonies (typically 1 CFU or 2 CFU) were recovered beyond five days of incubation during the single-incubation studies; however, those results were not statistically significant, suggesting that EM regimes seldom need to go beyond
five days of incubation at a given temperature range.
Our study also revealed that a change of temperature during a dual-incubation regime produces no significant effect on the number of colonies that are recovered from samples. Moreover, our single-incubation studies highlighted that, after a defined period, no significant changes occurred in the number of colonies yielded at each temperature, with the 30–35 °C range performing marginally better for bacteria. That result suggests that it would be worthwhile to explore the possibility of a single-incubation regime using a broader selection of samples from cleanrooms.
Although a review of incubation parameters is important, the key to a successful EM program is to embed consistency into its processes. That includes using the same culture media throughout (whether that be a single medium or two different types), the same incubation parameters, and the same sample locations, all to build up a large enough data set for trending. That activity enables responses to alert and action-level events, changes in total or mean colony counts, and changes in contamination profile. Consistent performance of an EM program helps to identify and manage drifts appropriately.
References
1 Moldenhauer J. Justification of Incubation Conditions Used for Environmental Monitoring. Amer. Pharm. Rev. 1 April 2014; https://www.americanpharmaceuticalreview.com/Featured-Articles/158825-Justification-of-Incubation-Conditions-Used-for-Environmental-Monitoring.
2 Guinet R, et al. Multicentre Study on Incubation Conditions for Environment Monitoring and Aseptic Process Simulation. PDA J. Pharm. Sci. Technol. 71(1) 2017: 43–49; https://doi.org/10.5731/pdajpst.2016.006791.
3 Sage A, Timas N, Jones D. Determining Incubation Regime and Time to Results for Automated Rapid Microbiology EM Methods. Eur. J. Parent. Pharm. Sci. 19(2) 2014: 45–55.
4 Brown MRW, Gilbert P. Increasing the Probability of Sterility of Medicinal Products. J. Pharm. Pharmacol. 29(1) 1977: 517–523; https://doi.org/10.1111/j.2042-7158.1977.tb11387.x.
5 Jameson JE. A Discussion of the Dynamics of Salmonella Enrichment. J. Hygiene 60(2) 1962: 193–207; https://doi.org/10.1017/s0022172400039462.
6 Tidswell EC, Sandle T. Microbiological Test Data: Assuring Data Integrity. PDA J. Pharm. Sci. Technol. 72(1) 2018: 2–14; https://doi.org/10.5731/pdajpst.2017.008151.
7 Grice EA, et al. A Diversity Profile of the Human Skin Microbiota. Genome Res. 18(7) 2008: 1043–1050; https://doi.org/10.1101/gr.075549.107.
8 Symonds ID, Martin DL, Davies MC. Facility Based Case Study. A Comparison of the Recovery of Naturally Occurring Species of Bacteria and Fungi on Semi-Solid Media When Incubated Under Standard and Dual Temperature Conditions and Its Impact on Microbial Environmental Monitoring Approach. Eur. J. Parent. Pharm. Sci. 21(1) 2016: 7–15.
9 Sutton S. Environmental Monitoring Programme in a GMP Environment. J. GXP Compliance 14(3) 2010: 22–30.
10 Sandle T. Examination of the Order of Incubation for the Recovery of Bacteria and Fungi from Pharmaceutical Cleanrooms. Int. J. Pharm. Compounding 18(3) 2014: 242–247.
11 Marshall V, et al. Comparative Mold and Yeast Recovery Analysis: The Effect of Differing Incubation Temperature Ranges and Growth Media. PDA J. Pharm. Sci. Technol. 52(4) 1998: 165–169; http://journal.pda.org/content/52/4/165.short?rss=1&ssource=mfc.
12 Vijayakumar R, Sandle T, Manohran C. A Review of Fungal Contamination in Pharmaceutical Products and Phenotypic Identification of Contaminants By Conventional Methods. Eur. J. Parent. Pharm. Sci. 17(1) 2012: 4–18.
Corresponding author and BPI editorial advisor Tim Sandle, PhD, CBiol, FIScT, is head of microbiology at Bio Products Laboratory in Elstree, UK, and a visiting tutor at University College London and the University of Manchester; [email protected].
You May Also Like

