HCP Antigens and Antibodies from Different CHO Cell LinesHCP Antigens and Antibodies from Different CHO Cell Lines
January 19, 2017
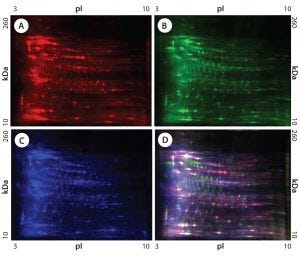
Figure 1: 2-D difference gel electrophoresis (DIGE) analysis of CHO DG44, BioWa CHO, and CHO K1 SV HCPs; (A) CHO DG44 HCP labeled with Cy5, red; (B) BioWa CHO labeled with Cy3, green; (C) CHO K1 SV labeled with Cy2, blue; (D) overlay image of Cy5, Cy3, and Cy2; the range of white to purple represents spots that are common to all three cell lines.
Cell lines derived from Chinese hamster ovary (CHO) cells are widely used in therapeutic protein production because they can perform human-compatible posttranslational modifications, they are easy to use for manufacturing, and they do not propagate most human pathogenic viruses (1, 2). Expressed therapeutic proteins are secreted into CHO culture supernatant along with impurities originating from the host cells themselves. Such host cell proteins (HCPs) are important contaminants for monitoring because they directly affect drug quality, safety, and efficacy.
HCPs are complex mixtures with diverse physicochemical and immunological properties (3). The genome sequence of the ancestral CHO K1 cell line suggests that the CHO genome has more than 24,000 genes and 29,000 transcripts (2). The first proteomic study of CHO-K1 identified about 6,000 proteins (4). Considerable genomic heterogeneity has been revealed among different CHO cell lines (1).
Recently, full-genome sequence analysis of seven CHO cell lines derived from the three CHO lineages used most frequently in therapeutic protein production (CHO K1, DG44, and CHO-S) demonstrated that each line harbors its own set of unique mutations (5). Those mutations can accumulate rapidly during cell line development (5). Because of instability and diversity in the CHO genome, HCP profiles can vary not only from cell line to cell line, but also within the same cell line used for expressing different proteins (unpublished data).
During downstream purification, HCPs should be reduced to the lowest achievable levels. Multiple analytical techniques such as immunoassays, gel electrophoresis, high-performance liquid chromatography (HPLC), and mass spectrometry (MS) have been used for HCP quantitation, detection, and identification (3, 6–12). Each technique presents its own advantages and disadvantages. Changes in the abundance of HCP species during process development have created additional challenges for accurately monitoring HCPs during purification as well as in final drug substances.
A preferred means for HCP detection is the multianalyte enzyme-linked immunosorbent assay (ELISA) used with anti-HCP polyclonal antibodies raised against HCP mixtures. The assay is sensitive, semiquantitative, and relatively easy to perform. HCP levels measured by ELISA are used for setting control limits and specifications to demonstrate manufacturing capability and process robustness. The level of HCPs in a drug substance is expressed in nanograms of HCPs quantified by ELISA per milligram of drug substance (ng/mg). Although no general limit has been established for acceptable HCP levels, <100 ng/mg is used commonly in the biopharmaceutical industry for setting HCP specifications (13). For therapeutic monoclonal antibodies (MAbs) and other proteins reviewed by the US Food and Drug Administration (FDA), HCP levels have been 1–100 ng/mg (14).
HCP ELISA values reflect the level of specific immunoreactivity of HCPs present to the anti-HCP antibodies. Those values largely depend on the anti-HCP antibodies and HCP standards used for their assessment. In general, the first step of ELISA development is to prepare a CHO HCP standard that is representative of a given cell line and biomanufacturing process. Typically, a standard is prepared from null-strain culture supernatant because CHO HCPs present in a process come from the culture supernatant. Prepared CHO HCP standards also can be used to generate anti-CHO HCP antibodies.
In this study, we investigated CHO HCP profiles from four CHO HCP standards prepared from CHO DG44, BioWa CHO, super CHO K1, and CHO K1 SV culture supernatants by two-dimensional fluorescence difference gel electrophoresis (2-D DIGE). To compare coverage and reactivity between custom and commercial antibodies as well as those raised against culture supernatants and cell lysates, we evaluated three custom anti-CHO HCP antibodies and two commercial anti-CHO HCP antibodies. One custom antibody was raised against CHO DG44 culture supernatant, and the other two were raised against CHO K1 SV supernatant. Of the two commercial anti-CHO HCP antibodies, one was prepared from CHO culture supernatants and the other from cell lysates.
To understand how different HCP standards and antibodies could affect the HCP ELISA values, we determined HCP levels from in-process purification samples derived from those four cell lines using different CHO HCP standard and antibody combinations. We also determined the coverage and measured HCP ELISA values from antibody mixtures.
Materials and Methods
Null Strains of CHO Cell Lines: For this study we used four different CHO cell lines: CHO DG44, BioWa CHO, Super CHO K1, and CHO K1 SV, all routinely used at GlaxoSmithKline. The DG44 cell line is dihydrofolate reductase minus (DHFR–), and the BioWa cells are a Potelligent DG44 cell line deficient in fucosyltransferase 8 (FUT8). Both Super CHO K1 and CHO K1 SV are derived from the CHO K line. We generated a null strain of each line by transfecting cells with their corresponding vectors (without the product-encoding genes).
HCP Standards: We generated a CHO HCP standard from each null strain using manufacturing processes corresponding to those of the production strain: the same culture media, temperature, pH, and dissolved oxygen. The cell culture scale for each standard ranged from 3 L to 35 L, based on intended use. Upon harvest, culture supernatant was concentrated and diafiltered with phosphate-buffered saline (PBS). We determined protein concentrations using a bicinchoninic acid (BCA) protein assay kit (Pierce Biotechnology). For proprietary reasons, we cannot include details of cell culture conditions and concentration procedures herein. We used the resulting concentrates as HCP standards for our CHO HCP ELISA. CHO DG44 and CHO K1 SV HCP standards also served as immunogens to produce custom anti-CHO DG44 and anti-CHO K1 SV HCP antibodies, respectively.
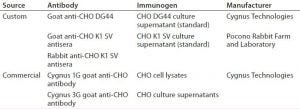
Table 1: Antibodies to Chinese hamster ovary (CHO) host cell proteins (HCPs) used in this study
HCP Antibodies: Table 1 provides information on two commercially available and three custom anti-CHO HCP antibodies used in this study. Cygnus Technologies purifies anti-CHO DG44 and Cygnus anti-CHO HCP antibodies using affinity chromatography with their corresponding CHO HCP immunogens. The two anti-CHO K1 SV antibodies (rabbit and goat anti-CHO K1 SV) are unpurified antisera. We evaluated both antisera for HCP coverage only and did not use them in the HCP ELISA.
For that assay, the nonbiotinylated form of the HCP antibody is used to capture HCPs in samples, and the biotinylated form is used to detect the HCPs. Because biotinylation of an antibody might affect its detection, we used the biotinylated antibody for Western blot coverage evaluation to simulate a worst-case scenario.
In-Process Samples (IPSs): For this study, we chose IPSs from four different monoclonal antibodies (MAb A, B, C, and D) expressed in the four different CHO cell lines. MAbs A–C have similar purification processes, whereas MAb D has a different purification process. In general, we used samples from the beginning, middle, and the end of the purification processes.
Two-Dimensional Gel Electrophoresis — Sample Preparation: Following the kit manufacturer’s instructions (15), we purified protein samples using a 2-D Clean-Up kit from GE Healthcare.
Protein Concentration: We measured protein concentration in the purified CHO HCPs using the 2-D Quant kit (GE Healthcare), following the manufacturer’s procedure up to the step of incubating reactant at room temperature (16). After incubation, reactant was transferred to a 96-well Microtiter plate (ThermoFisher) and read at 480 nm using a Molecular Device plate reader.
Protein Labeling: We labeled purified proteins with fluorescent dye (either Cy2, Cy3, or Cy5) using an Amersham CyDye DIGE Fluor minimal dye labeling kit (GE Healthcare), following the manufacturer’s protocol (17).
Isoelectric Focusing: For a final volume of 340 µL, we added 50 µg of CyDye labeled protein to a rehydration buffer: 7 M urea, 2 M thiourea, 4% CHAPS (w/v), 20 mM DTT, 0.5% (v/v) pH 3–10 nonlinear ampholyte. For isoelectric focusing, we used an 18-cm Immobiline DryStrip gel (IPG) pH 3-10 NL (nonlinear) strip with an IPGphor II system (GE Healthcare). Isoelectric focusing at 50 µA was based on the following program: 30 minutes rehydration, 10 hours at 30 V, 1 hour at 200 V, 1 hour at 500 V, 30 minutes from 500 V to 8,000 V, and 10 hours at 8,000 V.
Equilibration: Subsequently, we equilibrated the IPG strip in sodium-dodecyl sulfate (SDS) equilibration solution (75 mM Tris-HCl at pH 8.8 with 6 M urea, 29.3% v/v glycerol, and 2% w/v SDS) and 2% w/v dithiothreitol (DTT), followed by an alkylation equilibration in the SDS equilibration solution containing 2.5% w/v iodoacetamide.
SDS-PAGE Separation: We prepared 10–18% gradient gels using gradient former model 495 (Bio-Rad Laboratories) in a multigel casting chamber (also from Bio-Rad Laboratories). Then we carried out second-dimension (2-D) SDS polyacrylamide gel electrophoresis (SDS-PAGE) using a Protean II xi Cell system (Bio-Rad Laboratories) following manufacturer’s procedures (18).
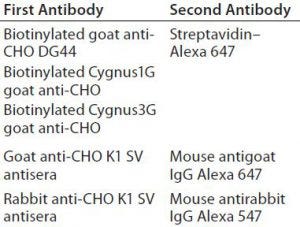
Table 2: First and second antibodies used for 2-D Western blot
Western Blot Analysis: Next we transferred the proteins to a low-fluorescence polyvinylidene difluoride (PVDF) membrane in Tris–glycine transfer buffer using the OWL VEP-3 large-tank electroblotting system from Thermo Fisher Scientific. After blocking in a Rockland blocking buffer (Rockland Immunochemicals), the membrane was incubated in the first antibody solution, followed by incubation with the second antibody. Table 2 summarizes those antibodies used for Western blotting. Following its final wash in Tris-buffered saline (TBS) with Tween 20 (TBS with and polysorbate 20) from Sigma Aldrich Fine Chemicals, we dried the membrane at room temperature.
Image Capture and Analysis: To scan all gels and membranes, we used a Typhoon FLA 9000 laser scanner from GE Healthcare. Each fluorescent dye was scanned using its corresponding laser and filter according to manufacturer’s instructions (19). All images were analyzed using PD Quest advanced 2-D gel analysis software (Bio-Rad Laboratories).
HCP ELISA: For the CHO HCP ELISA, we used a sandwich format with coating solution, wash buffer, blocker casein, tetramethylbenzidine (TMB) substrate, and TMB stop solution from Kirkegaard and Perry Laboratories. First, a Microtiter plate was coated with affinity-purified polyclonal goat anti-CHO HCP antibodies in the coating solution. After a blocking procedure, we added samples and HCP assay standards at different concentrations to the plate, followed by the biotinylated form of the same antibodies. Then we added streptavidin-conjugated horseradish peroxidase (SA-HRP) to the plate and initiated the HRP enzymatic reaction by adding TMB substrate. To terminate the reaction, we added TMB acidic stop solution before measuring color intensity at 450 nm. We determined the HCP concentration in each test sample using a standard curve of known HCP concentrations. For the HCP ELISA using a mixture, two antibodies were mixed in equal proportions by weight. All other assay conditions were identical to those above.
Results and Discussion
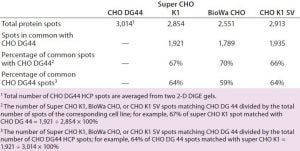
Table 3: Number of protein spots from CHO DG44, super CHO K1, BioWa CHO, and CHO K1 SV HCPs
We compared HCP profiles of CHO DG44, BioWa CHO, super CHO K1, and CHO K1 SV HCP standards using 2-D DIGE. Because up to three different CyDye-labeled protein samples can run simultaneously on a single 2-D gel, we split the four different standards into two groups on two gels. For reference, we ran Cy5-labeled CHO DG44 HCP on both gels. We mixed Cy5-labeled CHO DG44 HCP, Cy3-labeled BioWa CHO HCP, and Cy2-labeled CHO K1 SV HCP to run on one gel, mixing Cy5-labeled CHO DG44 HCP and Cy3-labeled Super CHO K1 HCP to run on a different gel. Each HCP standard was loaded at 50 µg/gel. With a 2-D DIGE detection limit of 0.15–0.5 ng of a single protein per spot, any protein present <0.15 ng goes undetected (20).
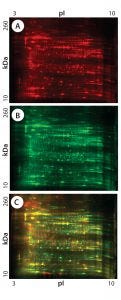
Figure 2: 2-D DIGE analysis of CHO DG44 and super CHO K1 HCPs; (A) CHO DG44 HCP labeled with Cy5, red; (B) Super CHO K1 with Cy3, green; (C) overlay Image of Cy5 and Cy3; yellow and orange represent proteins that are common to both cell lines.
Figures 1 and 2 are DIGE images of the four HCP standards. Figure 1 shows CHO DG44 (Cy5 in red), BioWa CHO (Cy3 in green), and CHO K1 SV (Cy2 in blue). Figure 2 shows CHO DG44 (Cy5 in red) and super CHO K1 (Cy3 in green). In the overlaid images in both figures (Figure 1D, Figure 2C), spots that do not overlap are shown in red, green, or blue.
We analyzed the spots using PDQuest 2-D gel analysis software to compare BioWa CHO, Super CHO K1, and CHO K1 SV with CHO DG 44 cell lines. The total numbers of protein spots are comparable for CHO DG44, Super CHO K1, and CHO K1 SV cell lines (Table 3). However, FUT8-deficient BioWa CHO cells show ~10–15% fewer spots than those three did.
We calculated the percentage of Super CHO K1 spots matching the CHO DG 44 spots by dividing the number of matched spots by the total number of Super CHO K1 spots (1,921 ÷ 2,854 = 67%). We calculated the percentage of CHO DG44 spots matching the Super CHO K1 spots by dividing the number of matched spots divided by the number of the total CHO DG44 spots (1,921 ÷ 3,014 = 64%). And we performed the same calculations for BioWa CHO and CHO K1 SV cell lines.
The percentages of Super CHO K1, BioWa CHO, and CHO K1 SV spots matching the CHO DG44 spots were determined to be 67%, 70%, and 66%, respectively. The percentages of CHO DG44 spots matching the Super CHO K1, BioWa CHO, and CHO K1 SV spots were 64%, 59%, and 64%, respectively. HCPs present in these culture supernatants are either secreted proteins or cellular content released from lysed cells. Thus they represent a subset of the total CHO cell proteome (21). The differences in these HCP profiles could be caused by factors such as cell line, culture conditions, and culture scale.
2-D Western Blot Analysis: To evaluate coverage of the two commercial antibodies and three custom-prepared antibodies (Table 1) to the four CHO HCP standards, we performed 2-D Western blotting, with 50 µg of each HCP standard labeled with Cy2. Each membrane containing one Cy2-labeled HCP antigen was probed with the biotinylated anti-CHO DG44, Cygnus 1G, or Cygnus 3G anti-CHO HCP antibodies followed by streptavidin labeled with Alexa 647 dye from Jackson Immunoresearch. We used one membrane for each antigen and each antibody and PDQuest advanced 2-D gel analysis software for spot analysis. Coverage of an anti-CHO HCP antibody to an HCP standard is determined by dividing the total number of Western blot spots by the total protein spots from that blot containing proteins directly labeled with the Cy2 dye.
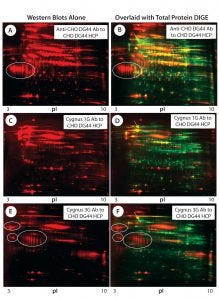
Figure 3: 2-D Western blot of CHO DG44 HCP; (A, C, E) Western blot probed with the anti-CHO DG44, Cygnus 1G, and 3G anti-CHO HCP antibodies (Abs), respectively; (B, D, E) overlaid images of Western blot (red) with protein spots (green), corresponding to A, C, and E; some acidic clusters are circled, and the high-abundance spot that was detected only by the Cygnus 1G antibody is indicated by an arrow in images B, D, and F.
Figures 3A, 3C, and 3E are Western blot images (red spots) for a CHO DG44 HCP standard probed with three different antibodies. Figure 3A was probed with the custom anti-CHO DG44 HCP antibody; Figures 3C and 3E were probed with commercial antibodies from Cygnus Technologies. Figures 3B, 3D, and 3F show corresponding total protein images and Western blot overlays for the CHO DG44 HCP detected by the three respective antibodies. In the overlaid images, Western blot spots are red and total protein spots are green. Yellow and orange spots are detected by both Western and 2-D DIGE, indicating that those proteins are immunogenic and present above the level of detection for 2-D DIGE. The 2-D Western blots exhibit significantly different patterns when probed with the three different antibody preparations.
Red Western blot spots in the overlaid images (Figures 3B, 3D, and 3F) suggest proteins that are low-abundance HCPs (levels below 2-D DIGE’s detection limit). However, many such low-abundance HCPs show strong immune responses to the anti-CHO HCP antibodies raised against CHO culture supernatants.
For example, both anti-CHO DG44 and Cygnus 3G antibodies exhibit strong reactivity to the acidic protein clusters (circled) in Figure 3. Note that the Cygnus 1G anti-CHO HCP antibody raised against CHO cell lysates did not detect those acidic protein clusters (Figures 3C and 3D).
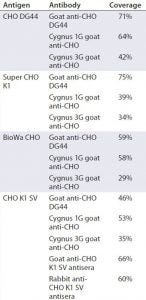
Table 4: 2-D Western blot coverage of antiCHO HCP antibodies to CHO HCPs
The green spots in the overlaid images show HCPs that are not detected by the anti-CHO HCP antibodies. Notable is a high-abundance acidic protein (indicated by a yellow arrow on each image) that is detected only by the Cygnus 1G antibody, but not by the other antibodies.
Based on a comparison with published data (6), we believe that protein might be the 78-kDa glucose-regulated protein (pI 5.1). The Cygnus 1G antibody is the only one used in this study that was raised against the cell lysate, whereas the rest of the antibodies were raised against culture supernatants. Clearly, this high-abundance protein is present in all culture supernatants but has failed to elicit an immune response when it is in them.
Similar Western blot patterns occur with the Super CHO K1, BioWa CHO, and CHO K1 SV HCP cell lines using anti-CHO DG44, Cygnus 1G, and Cygnus 3G antibodies (images not shown).
Because the goat and rabbit anti-CHO K1 SV HCP antibodies came from different hosts, we analyzed them with multiplex Western blotting. A membrane containing CHO K1 SV HCPs labeled with Cy2 was probed with a mixture of both antibodies, followed by mouse antigoat IgG Alexa 647 and mouse antirabbit IgG Alexa 547 dyes (Jackson ImmunoResearch).
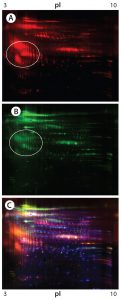
Figure 4: 2-D Western blot of CHO K1 SV HCP; (A) Western blot by the goat anti-CHO K1 SV antisera (red spots); (B) Western blot by the rabbit anti-CHO K1 SV antisera (green spots); (C) overlaid images; Western blot spots by the goat and rabbit anti-CHO K1 SV antisera are in red and green, respectively, whereas the total HCP spots are in blue.
Both antibodies reacted strongly with some low-abundance acidic protein clusters (circled in Figures 4A and 4B); however, those acidic clusters do not seem to be the same ones that were recognized by the anti-CHO DG44 and Cygnus 3G antibodies (not shown). Blue spots in the overlay image (Figure 4C) represent the total protein spots, many of which are not detected by either antibody.
Table 4 summarizes the coverage determined by 2-D Western blot for each anti-HCP antibody to the four different HCP antigens. In general, custom anti-CHO HCP antibodies have better coverage for their specific cell lines than other HCP antibodies that are not cell line specific. For example, of the three antibodies tested against CHO DG44 HCPs, the custom anti-CHO DG 44 HCP antibody has the highest coverage of 71%, whereas the Cygnus 1G and 3G antibodies have coverages of 64% and 42%, respectively. No custom antibody has been made to Super CHO K1 HCPs because the anti-CHO DG44 antibody showed broad coverage of 75% to the Super CHO K1 standard.
Mixing Antibodies Improves Coverage: As Figures 3 and 4 show, Western blot spot patterns could differ significantly among different HCP antibodies. Therefore, mixing two or more HCP antibodies should improve coverage. Here we present an example of mixing antibodies raised from cell lysate and culture supernatant to determine the resulting coverage.
We determined the coverage of single antibodies to anti-CHO DG44, Cygnus 1G, and Cygnus 3G antibodies for BioWa CHO to be 59%, 58%, and 29%, respectively (Table 4). Cygnus 1G antibody raised from cell lysate has a considerably different Western blot pattern from that of Cygnus 3G and anti-CHO DG44 HCP antibodies raised against culture supernatants (Figure 3). Thus, we predicted that mixing the anti-CHO DG44 and Cygnus 1G antibodies together would increase the HCP population coverage significantly. We developed a 2-D Western blot by mixing the Cygnus 1G and anti-CHO DG44 antibodies in equal ratios.
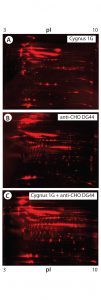
Figure 5: 2-D Western blot of BioWa CHO HCP by individual and mixed antibodies; (A) Western blot by the Cygnus 1G antibody; (B) Western blot by the anti-CHO DG44 antibody; (C) Western blot by the 1:1 mixed Cygnus 1G and anti-CHO DG44 antibodies
As Figure 5 shows, the antibody mixture has broader detection coverage than the single antibodies alone. A total of 2,665 protein spots were detected, with 2,443 Western blot spots detected by the antibody mixture. The coverage increased by ~34% to 92% (2,443 ÷ 2,665) (Table 5).
CHO HCP Antibody Reactivity: Using antibodies raised to CHO HCPs, we evaluated their reactivity to the HCP proteins using a sandwich ELISA method optimized using a CHO DG44 HCP standard and anti-CHO DG44 HCP antibodies. We used the goat anti-CHO DG44, Cygnus 1G, and 3G CHO HCP antibodies in the ELISA with the four CHO HCP standards on the same plate. HCP standards were diluted to make a standard curve in the assay range of 2–75 ng/mL; samples were diluted into the linear dose-response range. Assay conditions and antibody concentrations were the same in each case.
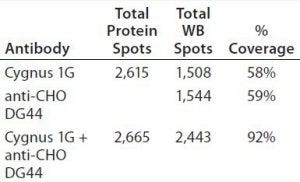
Table 5: Coverage of individual and mixed antibodies to BioWa CHO HCP estimated by PDQuest advanced 2-D gel analysis software
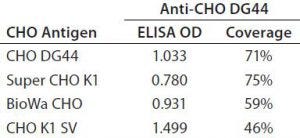
Table 6: Different CHO HCP antigen ELISA responses at 20 ng/mL and 2-D coverage by anti-CHO DG44 antibody
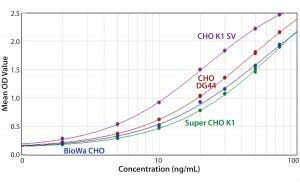
Figure 6: ELISA standard curves generated from four different CHO antigens with the anti-CHO DG44 HCP antibody used for detection
In general, when using the same antibody, the shapes of the standard curves from the four CHO HCP standards are similar. Figure 6 shows representative standard curves for the four CHO HCP standards run with the anti-CHO DG44 HCP antibodies. There is no correlation between ELISA response (OD) and coverage. A higher ELISA response does not correlate with broader coverage, as determined by the 2-D Western blot (Table 6). For example, we compared ELISA responses at 20 ng/mL because it is around the middle of the standard curves, so the difference is more pronounced. The highest ELISA response of 1.499 is obtained with the CHO K1 SV standard detected by anti-CHO DG44 antibody; however, the coverage determined by 2-D Western blot is only 46%. By contrast, a low ELISA response of 0.78 obtained with the Super CHO K1 standard detected with anti-CHO DG44 antibody revealed a 2-D Western blot coverage of 75%.
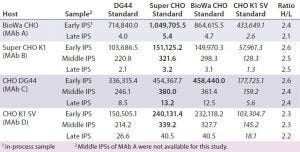
Table 7: Comparing HCP levels (ng/mg) of different in-process samples from different hosts (MAbs A–D) calibrated with the four different CHO HCP standards and detected by the anti-CHO DG44 antibody; for this ELISA, wells were coated with the anti-CHO DG44 HCP antibody and detected with the biotinylated anti-CHO DG44 HCP antibody in a sandwich format. Standards for calibration were used as indicated in the top row. The ratio of H to L was calculated by dividing the highest value (bold) by the lowest value (italics).
To help us understand the impact of different HCP standards and antibodies on HCP levels determined by ELISA, we studied IPSs from MAbs expressed by the four different cell lines. The samples represent the beginning, middle, and end of the MAb purification process. We tested them with the HCP ELISA using our four different HCP standards and the anti-CHO DG44 antibody (Table 7). So each sample has four measured ELISA values calibrated from four different CHO HCP standards.
We observed a distinct trend in which the ELISA values from the Super CHO K1 and BioWa CHO HCP standards are similar and highest, followed by CHO DG44 and CHOK1 SV HCP standards. To better compare the measured ELISA values, we calculated the ratios of the highest ELISA value (bold) to the lowest ELISA value (italics) within the same host and found less than a threefold difference in their ratios regardless of the stage of purification or cell line. These results indicate that when testing samples from the same host while changing HCP standards prepared from the four culture supernatants, the HCP ELISA values can be expected to fall within threefold of each other. That could prove to be valuable information for analytical and process development scientists because of likely scenarios when process development needs to take place before appropriate HCP standards are available.
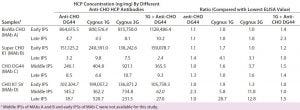
Table 8: Comparing in-process HCP levels (ng/mg) for different anti-CHO HCP antibodies; HCPs were quantitated by ELISA using different CHO HCP antibodies calibrated with their respective host HCP standards (indicated in the first column). For example, the two in-process samples derived from MAb A process were calibrated with BioWa CHO HCP standard when detected by the four HCP antibodies. The lowest ELISA values for each sample are in italics. Ratios were calculated by dividing each of the four ELISA values by the lowest such value (italics) in that row.
We also tested our IPSs using anti-CHO DG44, Cygnus 1G, and Cygnus 3G HCP antibodies as well as a 1:1 mixture of anti-CHO DG 44 and Cygnus 1G CHO HCP antibodies. We quantified the HCPs using each sample’s respective HCP standard, so each sample has four HCP ELISA values. To better compare those ELISA values, we identified the lowest value for each sample and calculated the ratios of each ELISA value to that lowest value (Table 8).
Overall, HCP levels from the early IPSs quantified by different antibodies fall within twofold difference: HCP populations in the early IPSs might be similar to those in the standards prepared from culture supernatant. We observed similar clearance trends among different antibodies. Late-process samples for the CHO K1 SV cell line showed significant differences in HCP levels. For example, the lowest HCP level of a late-IPS of MAb D is obtained with the anti-CHO DG44 antibody (18.1 ng/mg), which is ~29-fold and ~13-fold lower than levels obtained with the Cygnus 1G (520.7 ng/mg) and 3G (231.5 ng/mg) antibodies, respectively.
We see no trend in how combining antibodies (anti-CHO DG 44 and Cygnus 1G CHO HCP antibodies) would affect sample ELISA values. Combining antibodies does not necessarily always produce higher or lower ELISA values than single-antibody detection. As demonstrated with the 2-D Western blots, HCP populations detected by the three antibodies have varied significantly. Additionally, the HCP profiles and abundance are likely to change through a purification process. As a result, more significant differences in the ELISA values will be observed with different antibodies for late IPSs.
Because of the anti-CHO DG44 antibody’s strong immunoreactivity to low-abundance protein clusters in the standard shown on 2-D Western blots (Figure 3), the ELISA value of the late-IPS obtained from anti-CHO DG44 antibodies may have underreported the sample’s HCP level if those low-abundance clusters are eliminated during purification process. Therefore, ELISA values reflect the immunoreactivity of certain HCP populations in samples calibrated with dominant immunoreactive HCPs from standards, but not necessarily the true amount of HCPs in all samples.
Mining the Data for Answers
HCP profiles of four CHO HCP standards derived from the culture supernatants of CHO DG44, CHO K1 SV, BioWa CHO, and super CHO K1 cell lines show some variation in 2-D DIGE and their degree of antibody coverage in 2-D Western blot. In general, the custom antibodies have broader coverage than the noncustom antibodies do. However, we also observed that the anti-CHO DG44 antibody exhibits slightly better coverage to super CHO K1 HCPs (75%) than to CHO DG44 HCPs (71%), and the commercial Cygnus 1G antibody has a coverage of 64% for CHO DG44 HCPs. These results suggest that generating a cell-line–specific antibody may be unnecessary as long as the anti-HCP antibodies demonstrate broad coverage to an HCP standard that represents the cell line and process.
2-D Western blots demonstrate that different antibodies can detect considerably different HCPs, especially the Cygnus 1G antibody. That antibody presents 2-D Western blot patterns distinct from the other anti-CHO HCP antibodies raised against CHO culture supernatants. Therefore, broader coverage can be achieved by mixing two or more antibodies together. For example, we improved coverage for the BioWa CHO HCP by 34% through mixing the Cygnus 1G and anti-CHO DG44 HCP antibodies. So for detecting BioWa CHO HCPs, we will use the mixed Cygnus 1G and anti-CHO DG44 HCP antibodies in our HCP ELISA rather than generating a custom antibody to BioWa CHO. Such an approach can save assay development time and cost. These results also gave us new insights for future custom antibody production to achieve broader coverage.
Nevertheless, broader coverage does not necessarily provide higher measured HCP ELISA values. Depending on the HCP standard and antibody used in an assay, different HCP populations could be recognized, giving different ELISA responses. Our work presented herein suggests that the choice of anti-CHO HCP antibody can alter ELISA values significantly more than the choice of HCP standards does when those standards all are prepared from culture supernatants.
Although the four evaluated CHO HCP standards exhibit different HCP profiles, those differences do not change the ELISA values for IPSs by more than threefold. By contrast, significant differences come with different antibodies for late-process samples because the HCP populations and abundances can change during purification processes. These results demonstrate that the ELISA method is a reliable means to monitor HCP clearance while reinforcing the fact that limitations remain for accurately measuring total HCP levels.
Acknowledgments
The authors thank Zachary Ssebatindira for his contributions to ELISA experiments; Drs. Roxana Butoi, Shing Mai, Dwight Moore, and Jacek Mozdzanowski for their valuable comments and discussions; Marisa Jones for providing biotinylated anti-CHO DG44 HCP antibodies; and all the scientists involved in preparation of CHO HCP standards.
References
1 Wurm F, Hacker D. First CHO Genome. Nat. Biotechnol. 29, 2011: 718–720.
2 Xu X, et al. The Genomic Sequence of the Chinese Hamster Ovary (CHO)-K1 Cell Line. Nat. Biotechnol. 29, 2011: 735–741.
3 Zhu-Shimoni J, et al. Host Cell Protein Testing By ELISAs and the Use of Orthogonal Methods. Biotechnol. Bioeng. 111, 2014: 2367–2379.
4 Baycin-Hizal D, et al. Proteomic Analysis of Chinese Hamster Ovary Cells. J. Proteome Res. 11, 2012: 5265–5276.
5 Lewis N, et al. Genomic Landscapes of Chinese Hamster Ovary Cell Lines As Revealed By the Cricetulus Griseus Draft Genome. Nat. Biotechnol. 31, 2013: 759–765.
6 Champion KM, et al. A TwoDimensional Protein Map of Chinese Hamster Ovary Cells. Electrophoresis 20, 1999: 994–1000.
7 Hoffman K. Strategies for Host Cell Protein Analysis. BioPharm 13(6) 2000: 38–45.
8 Schenauer MR, et al. Identification and Quantification of Host Cell Protein Impurities in Biotherapeutics Using Mass Spectrometry. Analyt. Biochem. 428, 2012: 150–157.
9 Tcheliessnig AL, et al. Host Cell Protein Analysis in Therapeutic Protein Bioprocessing: Methods and Applications. Biotechnol. J. 8, 2013: 655–670.
10 Reisinger V, et al. A Mass Spectrometry-Based Approach to Host Cell Protein Identification and Its Application in a Comparability Exercise. Analyt. Biochem. 463, 2014: 1–6.
11 Zhang Q, et al. Comprehensive Tracking of Host Cell Proteins During Monoclonal Antibody Purifications Using Mass Spectrometry. MAbs 6, 2004: 659–670.
12 Hayduk EJ, et al. A Two-Dimensional Electrophoresis Map of Chinese Hamster Ovary Cell Proteins Based on Fluorescence Staining. Electrophoresis 25, 2004: 2545–2556.
13 Wolter T, et al. Assays for Controlling Host-Cell Impurities in Biopharmaceuticals. BioProcess Int. 2(3) 2005: 40–46.
14 Champion K, et al. Defining Your Product Profile and Maintaining Control Over It, Part 2: Challenges of Monitoring Host Cell Protein Impurities. BioProcess Int. 9(8) 2005: 52–57.
15 80-6486-60PS AE: 2-D Clean-Up Kit. GE Healthcare: Uppsala, Sweden, April 2009; https://www.gelifesciences.com/gehcls_images/GELS/Related%20Content/Files/1314729545976/litdoc80648660_20161013210013.pdf.
16 80-6486-22PS AE: 2-D Quant Kit. GE Healthcare: Uppsala, Sweden, April 2009; https://www.gelifesciences.com/gehcls_images/GELS/Related%20Content/Files/1314729545976/litdoc28954714_20161013212232.pdf.
17 RPK0272PL AG: Amersham CyDye DIGE Fluors (Minimal Dyes) for 2D DIGE. GE Healthcare: Uppsala, Sweden, November 2013; https://www.gelifesciences.com/gehcls_images/GELS/Related%20Content/Files/1314729545976/litdoc28953163_20161014015030.pdf.
18 M1651801 Rev C: PROTEAN II xi Cell, PROTEAN II xi 2-D Cell Instruction Manual. Bio-Rad Laboratories, Inc.: Hercules, CA; http://www.bio-rad.com/webroot/web/pdf/lsr/literature/M1651801.pdf.
19 28-9607-65 AB: Typhoon FLA 9000 User Manual. GE Healthcare: Uppsala, Sweden, December 2009; www.gelifesciences.com/gehcls_images/GELS/Related%20Content/Files/1314787424814/litdoc28960765_20161014232037.pdf
20 Lilley KS, et al. All About DIGE: Quantification Technology for DifferentialDisplay 2D-Gel Proteomics. Exp. Rev. Proteom. 4, 2004: 401–409.
21 Jin M, et al. Profiling of Host Cell Proteins By Two-Dimensional Difference Gel Electrophoresis (2D-DIGE): Implications for Downstream Process Development. Biotechnol. Bioeng. 105, 2010: 306–316.
At the time of this work, corresponding author Haiyan Liu was an investigator for GlaxoSmithKline (now at Bristol-Myers Squibb Company; [email protected]; 1-978-784-6838). Will Riches is CMC team leader, Melissa Hyland was a scientist, Shumin Zhang is a senior scientist, Michael Byrne is director of analytical sciences, and John R. White is director of biopharmaceutical assay development, all in bioanalytical science and biopharmaceutical development at GlaxoSmithKline, 709 Swedeland Road, King of Prussia, PA 19403.
You May Also Like


