Investigation of Foreign-Particle Contamination: Practical Application of FT-IR, Raman, and SEM-EDS TechnologiesInvestigation of Foreign-Particle Contamination: Practical Application of FT-IR, Raman, and SEM-EDS Technologies
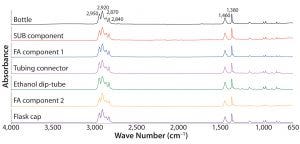
Figure 1: Absorbance Fourier-transform infrared (FT-IR) spectra of different test articles made of polypropylene
The presence of visible foreign particulate matter is considered a critical defect in parenteral products and one of the main reasons they can be recalled (1). Foreign particles present during any stage of manufacturing are considered to be contaminants and can impose a risk to the control of the manufacturing processes (2). For those reasons, particle contamination arising in any manufacturing step initiates a nonconformance or out-of-specification observation. That requires an investigation to identify root cause so as to mitigate the risk of repetition.
Investigations begin with particle identification. Appropriate analytical technologies must be used to determine particle composition. Elemental and chemical composition analyses and physical appearance characterization are commonly referenced methods (3). Whereas particle identification is a critical step in such investigations, finding the root cause of particle contamination can be challenging and time-consuming.
To improve our investigative effectiveness on root-cause determination, we have taken a proactive approach by constructing analytical libraries of raw materials, product-contact materials, and consumables that could generate particles and therefore contaminate a biomanufacturing process. Test articles used to build each library include filter assemblies, tubing, hoses, O rings, gaskets, vial stoppers, gowning supplies, packaging materials, and other miscellaneous items. To date, the total number of test articles is 228, and the library is updated regularly with additional materials.
Samples have been analyzed by Fourier-transform infrared (FT-IR) spectroscopy and in some cases Raman spectroscopy. FT-IR and Raman are both vibrational techniques that characterize the chemical structure of molecules. Generally, polar functional groups generate strong IR absorption whereas nonpolar functional groups induce strong Raman spectra (4). Raman spectroscopy is particularly beneficial for characterizing inorganic chemicals with characteristic vibrational energy shifts appearing in a spectral range <800 cm–1 (5). That low spectral range can be missed by FT-IR, depending on the use of different sample compartment accessories or microscopes.
Samples were also analyzed by scanning electron microscopy with energy-dispersive X-ray spectrometry (SEM-EDS). It is a well-established technology for characterizing size, morphology, and elemental composition of test articles. In principle, EDS differentiates unique X-ray emission of elements from beryllium after they are exposed to a focused beam of electrons, and it provides for qualitative or quantitative elemental analyses (6).
The primary objective of our study was to build analytical libraries of raw materials, product-contact materials, and consumables using analytical technologies commonly applied for particle investigations. We found that it is essential to use complementary technologies to achieve comprehensive characterization of foreign particles.
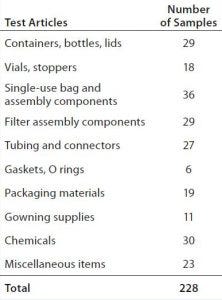
Table 1: Test articles used to build the analytical library
Materials and Methods
Consumables, product-contact materials, and raw materials (228 samples in total) were collected from three AstraZeneca manufacturing sites. We categorized those test articles into 10 groups based on their origins (Table 1). Each group contained similar products, either of differing sizes or supplied from different vendors. Filter and single-use bag assemblies comprised various components such as connectors, housings, and hoses. We also analyzed multicomponent chemicals such as cell culture media, feeds, and buffer solutions. Miscellaneous items included cleaning wipes, bench pads, autoclave bags, and a range of single-use items that we determined not to belong in any other groups listed in Table 1.
For analysis, we cut up bulk test articles into small pieces (several millimeters) and dried liquid chemicals using a rotary evaporator. We used chemicals that came in powder or crystal form directly for testing.
To date, we have analyzed 228 test articles by SEM-EDS using a Hitachi TM3030 scanning electron microscope and Bruker Quantax 70 energy-dispersive X-ray spectrometer. To do so, we affixed small pieces of test articles to carbon tabs (part number 77827 from Electron Microscopy Sciences), placing them on aluminum stubs and then inside the instrument under low vacuum. SEM images were acquired on EDX mode at low magnification. EDS analysis followed using the Quantax 70, which enables us to measure elements down to boron. We took EDS measurements for a minimum of 200 seconds.
Eight articles we had analyzed by SEM-EDS were not suitable for FT-IR analysis. But we analyzed 220 of 228 test articles using a Spectrum 400 FT-IR system from PerkinElmer with a universal attenuated total reflection (ATR) accessory. We placed test articles on a diamond top plate of the universal ATR and adjusted the pressure on them to ensure good contact between the samples and the plate. Spectra were acquired through eight accumulated scans within a range of 4,000–650 cm–1 at 4-cm–1 resolution. We also applied theoretical atmospheric correction of H2O and CO2 during spectral acquisition and used Spectrum 10 software (PerkinElmer) to acquire and process the IR spectra for analyses and annotation.
We characterized eight samples using a Raman DXR microscope from Thermo Scientific with a 532-nm, 10-mW laser. After determining the optimal acquisition time for each sample to increase the signal-to-noise ratio, we exposed the samples to the laser for a minute before Raman acquisition to photobleach the background fluorescence. And we used OMNIC software (Thermo Scientific) to acquire, analyze, and annotate the resulting Raman spectra. Finally, we identified chemicals based on our FT-IR and Raman spectra using a commercially available KnowItAll Informatics spectral library from Bio-Rad Laboratories.
Results and Discussion
We prepared FT-IR and EDS libraries with the materials listed in Table 1, converting the test articles’ FT-IR spectra to a searchable library using Spectrum 10 software and tabulating our EDS results in a Microsoft Excel file for manual searching. Then we further analyzed our FT-IR spectra and EDS results to understand the diversity of information built into them and the benefits of using multiple analytical technologies for particle investigations.
FT-IR analyses indicated that many test articles were made from the same polymer families. For example, 38 test articles were composed primarily of polyethylene, and 30 test articles were made of polypropylene. Those samples came from a wide range of materials: containers, packaging materials, single-use bag and filter assemblies, gowning supplies, and so on. We also found other redundant polymers in the library, including polydimethylsiloxane, polyamide, polyester, polyvinyl chloride, polycarbonate, and polysulfone. These observations suggest that applying only FT-IR to identify contaminant particles (especially those made of ubiquitous polymers) can be challenging because the contaminants can originate from many potential sources.
SEM-EDS measures the relative weight percentage of different elements. During this study, we isolated replicate samples from a single bulk material and analyzed them by EDS. Although the same elements were identified across replicates, the reported weight percentage of elements showed some variability (data not shown). The probable reason for that variability is the small area that EDS detectors sample (micrometer square or smaller) for each measurement, which may not represent the average composition of a given test sample. For that reason, we believe that the EDS library should be used for searching overall elemental profiles rather than absolute numerical agreement. In our current study, we present EDS results in relative quantities, reporting elements present at a minimum of 0.1% (w/w), which is a limit of detection (LoD) for the Quantax 70 EDS determined at our laboratory.
Adding SEM-EDS analysis to FT-IR analysis can increase the probability of identifying differences among materials with similar chemical composition. An example is polypropylene, a common polymer found in the library. Figure 1 presents
the FT-IR spectra of that derived from seven different test articles. All spectra were indistinguishable from one another, and all presented IR bands characteristic to polypropylene such as stretching modes of methyl and methylene groups around 2,950, 2,920, 2,870, and 2,840 cm–1 and bending modes at 1,460 and 1,380 cm–1 (7). Overall, those FT-IR spectra agree with the polypropylene spectrum in the KnowItAll commercial library (data not shown).
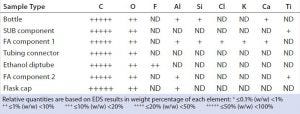
Table 2: EDS elemental profiles of different test articles made of polypropylene; ND = not detected, SUB = single-use bag, and FA = filter assembly
However, SEM-EDS analyses of the polypropylene samples revealed differences in their elemental composition. Table 2 summarizes the elemental profiles of polypropylene samples from Figure 1. The chemical formula of polypropylene is (C3H6)n. Because the EDS we used detects elements from boron up, carbon is the only element derived from polypropylene to generate an EDS signal. Oxygen and different sets of trace elements were observed in some samples, probably indicative of additives used to improve thermal, mechanical, and/or chemical stabilities of polypropylene, depending on the intended purposes of polymer products. Antioxidant phenolic compounds, calcium stearate, titanium oxide, and compounds for surface fluorination are just a few chemicals that can be used to mold polypropylene (8–10). Generally, EDS can identify additives or impurities present at trace quantities that may not be IR-active or are present in insufficient quantities to yield IR bands. So the EDS information can be crucial for identifying particles and their sources.

Table 3: EDS elemental profiles of stoppers; ND = not detected
EDS is also a useful adjunct to IR spectral analyses of test articles processed through the KnowItAll database. It runs an IR spectral search against a built-in library of >200,000 spectra. The program generates numerous search results based on composite spectral similarities, often suggesting the presence of unexpected chemical components. EDS results showing the elemental compositions of test articles allow analysts to eliminate nonrelevant IR spectral search hits, making chemical identification more likely.
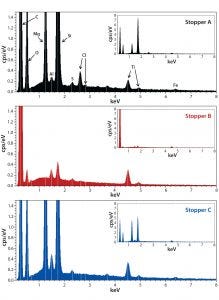
Figure 2: Energy-dispersive X-ray spectroscopy (EDS) spectra of stoppers A (top), B (middle), and C (bottom); all spectra are shown at the same scale for both the zoom and full (insets) views.
Raman spectroscopy is another useful technology for characterizing particle samples. Complementary to FT-IR, it is a vibrational spectroscopy that can reveal IR-inactive vibrational modes of chemical bonds. Raman may be needed for comprehensive characterization of heterogeneous samples. Material from drug-product vial stoppers is a good example of a complex material that requires all three analytical technologies.
We analyzed stoppers A, B, and C with both EDS and FT-IR for library preparation. Triplicate or quadruplicate samples came from each stopper, and their EDS-generated weight percentage of elements were averaged and reported in nonnumerical scales (Table 3). Each stopper presented a distinctive elemental profile. Overall, stoppers A and C presented similar elemental profiles, but stopper A contained a trace amount of chlorine (unique compared with other two stoppers). Stopper B consisted of primarily carbon and oxygen, with trace amounts of fluorine, sulfur, and aluminum. Figure 2 presents the corresponding EDS spectra of all three stoppers.
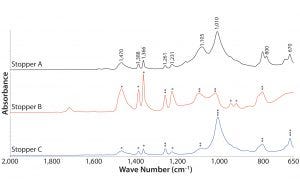
Figure 3: Absorbance FT-IR spectra of stoppers; IR bands characteristic to poly(isobutylene), silicone, and magnesium silicate all are labeled in wavenumbers on stopper A spectrum; poly(isobutylene) bands are labeled with * on stopper B and C; silicone IR bands are labeled with ** on stoppers B and C; and magnesium silicate IR bands are labeled with *** on stopper C.
Figure 3 presents FT-IR spectra of the three stoppers within the range 2,000–650 cm–1. All stoppers presented IR bands characteristic to poly(isobutylene) at 1,470, 1,388, 1,366, and 1,231 cm–1. Doublet bands at 950 and 923 cm–1 observed in stopper B also corresponded to poly(isobutylene). Both peaks appeared as shoulder peaks from stoppers A and C. Strong IR bands at 1,010 and 670 cm–1 in stoppers A and C corresponded to magnesium silicate, which is probably used as a filler. Instead of magnesium silicate, stopper B appeared to include silicone rubber, based on IR bands observed at 1,261, 1,105, 1,020, and 800 cm–1. Those silicone-related peaks were also present in stoppers A and C.
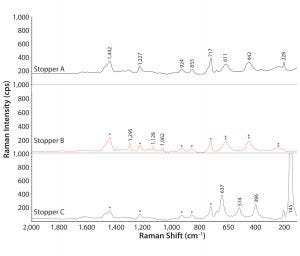
Figure 4: Absorbance Raman spectra of stoppers; Raman shifts characteristic to poly(isobutylene) and anatase are labeled in wavenumbers on stopper A spectrum; polyisobuytlene bands are labeled with * on stoppers B and C; anatase bands are labeled with ** on stopper B; and wavenumbers of Raman shifts corresponding to polyethylene and rutile are recorded on stopper B and stopper C, respectively. The peak at 145 cm–1 on stopper C is shown truncated in Raman intensity at this scale.
So we used Raman spectroscopy to analyze the stoppers. Figure 4 shows the resulting spectra in the range of 2,000–50 cm–1. Stoppers A, B, and C all generated Raman peaks corresponding to poly(isobutylene) around 1,442, 1,227, 924, 853, and 717 cm–1. Stopper B displayed additional Raman bands at 1,295, 1,128, and 1,062 cm–1, suggested by a KnowItAll Raman spectral search to be associated with methylene twisting and C–C bond stretching modes, which probably come from polyethylene (11). In addition to the organic chemicals, Raman spectroscopy also detected the presence of titanium oxide in all stoppers. Furthermore, it could distinguish the different crystal structures of titanium oxide (e.g., anatase and rutile). Raman shifts of rutile showed up in stoppers A and B at 611, 442, and 228 cm–1. The intense band at 145 cm–1 in stopper C is a major signature peak of anatase, and other anatase peaks at 637, 514, and 396 cm–1 also showed up for stopper C. Silicone-related bands were not distinguished by Raman, however, probably due to its inherently weak Raman signal compared with FT-IR as well as interference of other Raman shifts around 710 and 490 cm–1 where silicone-related Raman bands usually appear.
Application of all three analytical technologies gave us comprehensive stopper characterization. Stopper A consisted of poly(isobutylene), magnesium silicate, a silicone-based material, and rutile. Stopper B was made of poly(isobutylene), polyethylene, silicone rubber, and rutile. And stopper C contained poly(isobutylene), magnesium silicate, silicone, and anatase.
Work in Progress
We prepared FT-IR and EDS libraries of raw materials, product-contact materials, and consumables to facilitate investigations of foreign-particle contaminations in biomanufacturing processes. Analysis of these libraries indicated that combining EDS with FT-IR distinguishes subtle differences in trace elements present in test articles that are made of similar chemicals. Trace elements might be introduced intentionally as additives for raw-material manufacturing, or they may be impurities associated with specific raw materials. Adding Raman spectroscopy — especially for analysis of heterogeneous test articles — reveals chemical components that FT-IR cannot identify. So the combined application of FT-IR, SEM-EDS, and Raman spectroscopy for particle investigations helps ensure full particle characterization.
We are updating our libraries with critical materials that directly contact biological products throughout their manufacturing processes. We are expanding our studies to include multiple lots of materials for detecting lot-to-lot variability as well as profiling particulate contaminants analyzed in our investigations.
Acknowledgments
We acknowledge Dr. Kun Yao, Dr. Kuruppu Dharmasiri, and Christopher Shaw for helpful discussion and support; and Dr. James D’Alessio and Eric Beard for critical review.
References
1 Bukofzer S, et al. Industry Perspective on the Medical Risk of Visible Particles in Injectable Drug Products. PDA J. Pharm. Sci. Technol. 69(1) 2015: 123–139; doi:10.5731/pdajpst.2015.01037.
2 Borchert SJ, et al. Particulate Matter in Parenteral Products: A Review. PDA J. Pharm. Sci. Technol. 40(5) 1986: 212–241.
3 Wolfe J, Smith K. Forensic in QbD: Addressing Foreign Particulate Matter Investigation. Am. Pharmaceut. Rev. 2 September 2014; www.americanpharmaceuticalreview.com/Featured-Articles/167460-Forensics-in-QbD-Addressing-Foreign-Particulate-Matter-Investigations.
4 Wartewig S, Neubert RH. Pharmaceutical Applications of Mid-IR and Raman –Spectroscopy. Adv. Drug Deliv. Rev. 57(8) 2005: 1144–1170; doi:10.1016/j.addr.2005.01.022.
5 Hibben JH. Raman Spectra in Inorganic Chemistry. Chem. Rev. 13(3) 1933: 345–478.
6 Russ JC. Fundamentals of Energy Dispersive X-Ray Analysis. Butterworths: London, UK, 1984.
7 Andreassen E. Infrared and Raman Spectroscopy of Polypropylene. Polymer Sci. Technol. 2, 1999: 320–328.
8 Van Krevelen DW, Nijenhuis KT. Properties of Polymers. Elsevier Science: Amsterdam, The Netherlands, 2009.
9 du Toit FJ, Sanderson RD. Surface Fluorination of Polypropylene: 1. Characterization of Surface Property. J. Fluorine Chem. 98(2) 1999: 107–114.
10 Esthappan SK, et al. Effect of Titanium Dioxide on the Thermal Ageing of Polypropylene. Polymer Degrad. Stabil. 97(4) 2012: 615–620.
11 Lin-Vien D, et al. The Handbook of Infrared and Raman Characteristic Frequencies of Organic Molecules. Academic Press: Cambridge, MA, 1991.
Corresponding author Junghwa Kim, PhD is a scientist II, Derek Schildt is a scientist I, and Dipali Patel is an associate scientist II in the manufacturing science and technology biophysical laboratory at Frederick Manufacturing Center, AstraZeneca, 633 Research Court, Frederick, MD 21703; 1-301-228-5000; [email protected], [email protected], [email protected]. Simon Chen was a summer intern with them and is currently a student at the School of Public Health in the University of Maryland in College Park, MD.
You May Also Like


