Points to Consider in Quality Control Method Validation and TransferPoints to Consider in Quality Control Method Validation and Transfer
March 14, 2019
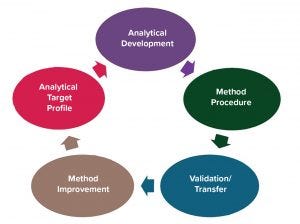
Figure 1: Analytical method lifecycle
The concept of an analytical lifecycle has been well received in the biopharmaceutical industry. In 2016, the US Pharmacopeia (USP) advocated for lifecycle management of analytical procedures (1) and defined its three stages: method design development and understanding, qualification of the method procedure, and procedure performance verification. The US Food and Drug Administration (FDA) has published guidance on process validation with a similar division into three stages: process design, process performance qualification, and process performance verification (2). For a manufacturing process, process performance must be monitored. For an analytical method, a method procedure performance must be monitored.
Following the analytical lifecycle concept, an analytical method lifecycle can be divided into five phases (Figure 1). Before you validate a method, you should have an analytical target profile in which you define a method development’s goals and acceptance criteria. That enables you to determine whether a method has developed in the way you need it to for control of product quality. The analytical target profile can be provisional in early development. For example, you may consider developing a quantitative test for impurity measurement and then evolve it to a qualitative limit test when there is a clear understanding that your process can remove the impurity consistently below the detection limit.
The next phase is analytical development, which involves work on method development for which quality by design (QbD) workflow can be considered. The next step is to prepare a method procedure following good manufacturing practice (GMP) documentation processes, especially for quality control (QC) related methods.
Method validation (or qualification) should follow good manufacturing practice (GMP) requirements to prove that a method is fit for purpose and meets requirements for intended use. Sometimes a method is used in more than one testing facility. So you must ensure that the method performs consistently in all facilities by performing an analytical transfer. Typically, transfer takes place postvalidation, but a method also can be covalidated at multiple sites (discussed below).
Sometimes, you might observe problems with a method during its use in a laboratory or during a method performance review. So method improvement allows further revision of a procedure, revalidation, or redevelopment of a method if necessary.
Then the method lifecycle circles back to the analytical target profile because in some cases, a developed method may have unexpected problems. So the analytical target profile would need to be revised or method development restarted for a new method.
Fit-for-Purpose Concept in Method Validation
Biomanufacturers can use one of several validation approaches, depending on how a method is defined and how it is chosen for purpose. Graduated validation is one example of why the fit-for-purpose concept should be considered. Validation requirements change (typically increase) as more stringent method performance information is required for late-stage product development. From early product development to late stage and product commercialization, you might have two or three rounds of validations. In early stages, a validation process should be fit for purpose and simple because not much is known about method performance, product characteristics, and manufacturing processes. As development moves toward late stage, validation is performed again because manufacturers have a better understanding of method performance, and the analytical target profile is more refined to match the product development stage.
At the commercialization stage, a full validation should be conducted according to ICH Q2R1 (3). That information must be included in the biologics license application (BLA). Normally, that is done during phase 3.
Generic validation also is a fit-for-purpose approach when methods are not product specific. In some companies, these may be called platform assays, which are not product specific. So you can use one method for several biological products. That is common for monoclonal antibodies (MAbs). Generic validation means you can validate a method using selected representative material and then apply the validation to other similar products. Then when you have a new product, you need to perform only a simple assessment on that product based on the generic validation package to demonstrate applicability of a generic validation to a new product. This is a powerful approach for new product testing to speed up investigational new drug (IND) submissions during early stages of product development.
Covalidation normally is conducted when a biomanufacturer needs to finish validation and transfer at the same time between different sites. While validation is performed at the first site, you can include certain studies at the second site (the method-receiving site). Typically, you can arrange for the intermediate precision, quantitation limit verification, or some specificity studies to be performed at the receiving site. When all data are combined, the validation status of a method is applicable to both sites.
Compendial verification is required for compendial methods. For example, a USP or European Pharmacopoeial (EP) method does not require full validation. However, a general practice in the industry is to verify a compendial method in conditions of use to ensure that it works as expected for a particular product tested.
The starting point of all validation approaches is to consider the purpose of a validation study itself during product development. The purpose of assays in manufacturing processes and the type of assays you plan to validate should be taken into account so that you can make the right decision about the type of approach to use.
Case Study: Fit-for-Purpose Spiking for SEC Validation
Size-exclusion chromatography (SEC) is an impurity assay for biological product testing. A spiking study is required for SEC validation. For this study, a known amount of impurity is added to the assay to determine whether the amount of recovery (a measurement of assay accuracy) is as expected. Typically, SEC is used to report the percentages of aggregates and low–molecular-weight (LMW) impurities. The spiking material represents the aggregates and the LMW species following the assay.
Obtaining Aggregates and LMW Material: SEC is used to separate impurities by size. So for this case study, the requirement was to match the size of the spiking material with the sizes of the aggregates and LMW impurities in the assay. The challenge was to obtain stable impurities and in enough quantities for the study. Different options can be used to address that challenge. Performing a stability or forced-degradation study collects those impurities or obtains some impurities from a purification process (purification cut-off impurities). The regular sample could have been fractionated to collect aggregates or LMW species from a product. That would have been a labor-intensive process if those species in the regular sample were in low concentration, making them difficult to collect.
Another approach was to use a chemical reaction to create aggregates and LMW material. In this case, aggregates are created by oxidation in a controlled mode. The chemical reaction can be designed to start the reaction at a certain time to obtain the amount of aggregates needed for a spiking study. The same concept can be applied to LMW species based on a reduction reaction, which also can be controlled based on reaction time. Thus, aggregates and LMW species can be generated to provide the spiked material for the study.
Spiking Study: Using those methods, researchers obtained the material for a SEC spiking study. For aggregates, the spiking study achieved good linearity between the expected aggregates spike and the actual peak area based on UV response. The correlation coefficient is close to one, and there was good correlation between the observed percentage of aggregates and the expected percentage of aggregates, with 90–100% recovery.
Researchers performed the same study on the LMW species. They observed good linearity between the peak area and expected %LMW. Results also showed good accuracy between the observed %LMW and expected %LMW, with 80–100% recovery. The LMW for an antibody product (which is the case for this study) sometimes has more than one peak. Both peaks were evaluated and showed good linearity and recovery.
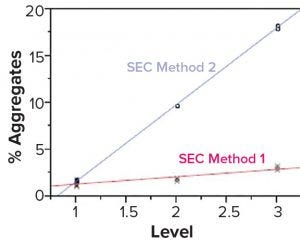
Figure 2: Both size-exclusion chromatography (SEC) methods showed good linearity and accuracy by dilution linear study but different responses to the spiking study.
Although a spiking study is good for proving that an assay works well, it can reveal potential analytical method problems. In this spiking study, researchers used the same spiked samples at different aggregate levels (1–3), representing three samples containing different percentages of aggregates (from low to high). We used two SEC methods to test the same samples (Figure 2). The blue line represents SEC method 2, which shows a sensitive response to the spike at this level. But the red line, which represents SEC method 1, shows that the response to the spike is poor, even though linearity could pass the dilution linearity study. In our case, we chose SEC method 2 because it had a more sensitive response at all levels, which made the test more reliable.
One purpose of an analytical transfer is to confirm the validation status of a method at a receiving laboratory. Globalization of the biomanufacturing industry is requiring companies to perform analytical transfers often. One site may be performing process or method development while a different site is conducting drug substance or drug product GMP manufacturing, and a third site is performing stability or other tests. That is the case especially for smaller companies, those that need to outsource GMP activities, and those that have different testing sites because of business needs. In some cases, capacity expansion or replacement of ageing facilities also may require analytical transfer.
Several risk-based transfer approaches can be taken. For a full validation, analytical transfer further confirms method validation status at a receiving laboratory. Some methods are quite stringent (e.g., safety methods), so a full validation might be required instead of an analytical transfer.
As discussed above, covalidation takes place when at least two laboratories together validate a method. A primary laboratory performs a full validation and includes receiving laboratories in the validation study. Receiving laboratories participate in the validation but perform selected activities rather than a full validation. All data should be presented in one validation package, and all laboratories are considered to be validated at the same time (instead of having separate transfers from one laboratory to another).
Another approach is to perform a compendial verification in a receiving laboratory. Compendial methods already are validated and official per USP or EP, for example. Such methods carry little or low risk of problems. So no complete analytical transfer is needed: Just verify your methods in a receiving laboratory by testing either system and sample suitability or selected validation characteristics to prove that a method is suitable for its intended use in a receiving laboratory. Alternatively, you can perform a risk assessment for basic compendial tests in a receiving laboratory as appropriate to waive the verification.
Another approach is a side-by-side comparative test, which is typical for quantitative impurity methods that require side-by-side comparison. Such tests must pass certain established criteria. This approach will be explained in more detail below.
Noncompendial verification is another concept. When a receiving laboratory already has similar methods established and validated, noncompendial verification can be performed instead of a side-by-side comparative test. This concept is likely to be used for platform assays, which are not product specific. For example, if you have a platform method established in a receiving laboratory for testing MAb A, and you want to have the same method to test MAb B in the receiving laboratory, then you can verify the method in the receiving laboratory as appropriate without a side-by-side comparative test.
Selection of the transfer approach should be based on risk and assay performance. If an assay performance is reliable, then you can simplify the approach or even waive a transfer with appropriate documentation.
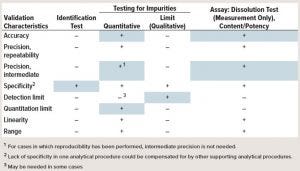
Table 1: Blue boxes indicate typical risked-based characteristics for transfer study. (“–” indicates that this characteristic is not evaluated typically in validation; “+” indicates that this characteristic is evaluated typically).
The validation characteristics for ICH Q2R1 are well established and can be found in the guidance (3). Table 1 lists typical risked-based transfer characteristics. For transfer studies, no universal guidance is available on what should be evaluated in an analytical transfer. The table shows in blue the typical transfer characteristics that should be considered for different assays. For example, an identity test, needs only to evaluate specificity at minimal. But for quantitative evaluation of impurities, the common practice is to test accuracy, precision, and quantitation limit. Other parameters may or may not be evaluated.
The “Points to Consider” box shows lessons learned for analytical transfer between different sites. Each point is critical, but often forgotten. Providing and receiving sites can have different cultures in communication, especially if they’re located in different countries.
Points to Consider |
|---|
Team Building: Providing and receiving sites may be culturally different. |
Method Transfer Overall Plan: Define the work flow, options, general requirements, and roles and responsibilities in a written document. |
Transfer Protocols and Reports: Define the template before the start of transfer. |
Samples and Reagents: Determine material plan, shipment, and expiration dates. |
Review Process: Define the review cycle from identified stakeholders (quality control and assurance). |
Data Management Systems: Consider the difference in laboratory information management systems (LIMS), chromatography data systems (CDS), and electronic document approval systems. |
The most important part before starting a transfer project is team building. Ensure that teams meet face to face to share information and build collaboration. A team should clarify the focal point, priority, and concerns with the project upfront and their preference of communication to keep the project on time.
A method transfer overall plan, which is sometimes called the analytical transfer master plan is a written document that defines the workflow and options of different transfer approaches per assay category as well as general requirements, roles, and responsibilities. Ideally, this plan should be approved so that both sides agree about how a transfer study should be executed. A well-prepared template for a transfer protocol and report is important when you have to work on different methods. Each method can have unique requirements and nuances, but it’s important to define the template at the start of a transfer project. Doing so will be efficient and improve consistency in the long run.
Samples and reagents also are important aspects because many times you have to pull representative material from production. You should consider the production schedules and timelines of the transfer studies so that you have the right material sampled at the right stage of your manufacturing process. Sometimes, it can take months to get material ready.
Another consideration is the shipment method. Special biological product samples require cold-chain and temperature traceability using a validated shipper. When a temperature excursion is observed, you might need to leverage product stability study data to determine whether the affected material is still suitable for use in transfer.
The expiration date is important to note because a transfer follows GMP, and you don’t want to use expired material. So when a material is approaching its expiration date, you might want to examine that material for further extension with supporting information or obtain new material.
A review process should involve all required stakeholders (including quality control and quality assurance, QA/QC), and they must all agree on the review documents. Sometimes, you will need to review and sign off on a data package from a receiving laboratory that does not use the same electronic document approval system as your laboratory. That means one site might be unable to access the other site’s data. This potential problem must be considered before starting a transfer study.
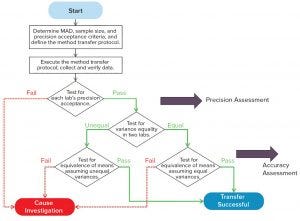
Figure 3: Side-by-side comparative test
Figure 3 shows a workflow for a side-by-side comparative test, which is used for quantitative assay transfers. Normally, it starts with determining the maximum allowable difference (MAD), sample size, and precision acceptance criteria — items in the method transfer protocol. Sample material is tested side by side at two laboratories for predefined replicates, similar to the precision-reproducibility study following protocol. Results are used to determine whether the test meets a laboratory’s precision acceptance criteria. If it does not meet that criteria, further investigation is needed. If precision criteria are met, the next step is to further determine equivalency of accuracy. Normally, a test for variance equality is needed at both laboratories to determine which statistical test should be used for accuracy assessment. If a method transfer follows the transfer protocol and passes all acceptance criteria, then a successful transfer will be concluded in the transfer report. If not, an investigation will need to be started, going back to the redesign of the transfer study or perhaps a reevaluation of the method for further improvement.
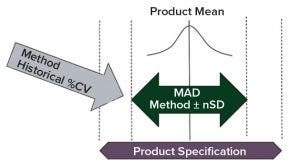
Figure 4: Determination of transfer acceptance criteria mean allowable difference (MAD) for side-by-side transfer; consider product specification, method historical variation (%CV), and product mean from historical batch data.
For a side-by-side transfer, an important acceptance criterion is the MAD between two laboratories. Normally, this is determined by evaluating product specification, method historical variation (e.g., percent coefficient of variation, %CV, based on a control chart or historical assay performance data), and the product mean from the historical batch data. With that information, the MAD typically can be set as a calculated number of method precision standard deviations (Figure 4). The MAD is set in a way to allow for an acceptable level of systematic difference of an analytical method between laboratories by evaluating the method mean difference. But this systematic difference should not increase the out-of-specification (OOS) rate in routine testing significantly.
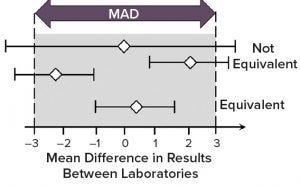
Figure 5: Demonstration of method equivalency by two one-sided t-test (TOST) in side-by-side method transfer; mean difference is shown as white diamonds and 90% confidence intervals as horizontal lines. (MAD = maximum allowable difference)
An equivalence test also is known as the two one-sided t-test (TOST). This is a typical approach for evaluating the transfer study data between providing and receiving sites. Both sites test the same sample (e.g., 10–20 replicated testing of the same sample at each site). Then all results are combined into the TOST evaluation.
Horizontal bars in Figure 5 indicate the 90% confidence interval for the difference in the means of data sets between providing and receiving sites, and white diamonds indicate the difference in the means. With a defined MAD, the whole bar should be bracketed by the MAD range (also called a goal post) if the method is equivalent by TOST analysis. If you have a diamond in the middle, and the bar extends outside the MAD range, then that is still considered to be a failure of transfer (not equivalent).
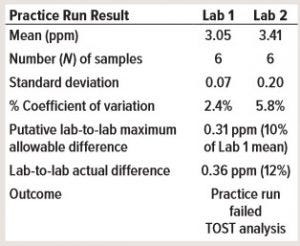
Table 2: Consider a practice run before method transfer with mock samples. Lab 1 is the providing laboratory, and Lab 2 is the receiving laboratory (TOST = two one-sided t-test).
Case Study: Practice Run Before Method Transfer
This case study demontrates why it is important to perform a practice run before a method transfer, especially for a side-by-side transfer. The practice run ideally should be performed before a transfer protocol is approved. In Table 2, a providing laboratory (Lab 1) determined a mean of about 3 ppm for a high-performance liquid chromatography (HPLC) impurity assay. The receiving laboratory (Lab 2) determined a mean of about 3.4 ppm in a practice run. The putative MAD was 0.31 ppm, which means that the practice run failed even before the start of the formal transfer study.
The first step of investigation was to review the assay, which was a typical reversed-phase HPLC assay with UV detection at 220 nm. Researchers established a standard curve using 1, 5, 10, 25, and 50 ppm for calibration. The assay required no dilution for the sample and control preparation, which was injected directly into HPLC for analysis. The control concentration was about 20 ppm impurity, and the control chart was used to estimate the putative MAD. First, researchers determined whether the stock standards and/or the preparation of standard curves were inconsistent between both laboratories. No inconsistencies were found.
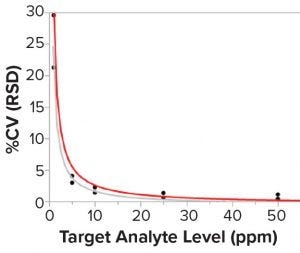
Figure 6: Correlation between the sample concentration and the assay precision (%CV); lines are fit for Lab 1 (gray) and Lab 2 (red). N = 6 standard curves for each sample in each laboratory.
Researchers then investigated potential differences when both laboratories prepared six runs independently to measure five mock samples at different concentration levels. Pipettes were switched between both laboratories to minimize the pipetting difference in standard-curve preparation. Figure 6 shows the results, which reveal that the mock sample had a much larger %CV at concentrations <10 ppm than at higher concentrations. Concentrations <10 ppm had 20–30 %CV. But at higher concentrations (e.g., between 20 and 50 ppm of the mock sample), there was not much variability with 2–3 %CV or less.
So the putative MAD probably was defined too tightly. It was based on an old control batch at 20 ppm. For the old control at 20 ppm, variability was tight. However, the actual sample for the transfer was <5 ppm, for which a larger variability should be allowed in the official transfer study. That helped researchers finalize the right MAD with more range during the official transfer.
Note that this observation is in line with the Horwitz equation. Expected relative standard deviation (RSD) could be roughly correlated using that equation: RSD % = 2C–0.1505, where C is the concentration of the analyte in the matrix expressed as a decimal (e.g., 1% = 0.01). The equation shows that at lower concentrations, RSD increases for the sample, control, or whatever material is provided for the test.
Case Study 3: Operator Interview in Transfer Troubleshooting
This case study is from an investigation of a transfer failure that included interviewing operators in two laboratories. The investigation found an unexpected difference in test procedure interpretation.
At the providing laboratory, an operator interpreted the test procedure as preparing a sample and vortex mixing then preparing a second sample and vortex mixing, and then a third sample and vortex mixing. In this way, the sample was more stable because the method prevents reagents in a sample from stress upon quick mixing. However, the receiving laboratory operator interpreted the standard operating procedure (SOP) as prescribing preparation of all three samples first and then vortex mixing all together at the end.
Investigators found that the SOP did not describe the approach explicitly. The SOP was updated so that operators easily could understand the requirements that each single sample should be prepared individually and vortex mixing immediately afterward. After the SOP was updated, the transfer study was repeated, and the study was completed successfully.
Upon approval of a transfer study report, several issues should be taken into consideration. A method transfer study proves method equivalency or suitability for use in a receiving laboratory at the time of transfer, but it does not address continuing improvements of assay performance at two sites. You should consider alignment of method performance monitoring and troubleshooting in the long run between providing and receiving laboratories after a transfer.
Qualification and management of critical reagents, analytical controls, and standards to support multiple sites also should be considered. Either the same material should be used, or the qualification requirements should be aligned. That will prevent discrepancy between assays used at different sites. Finally, consider change management for a test procedure, which should be aligned across different sites after a method transfer.
Essentials of Method Lifecycle Management
An analytical method lifecycle starts with defining an analytical target profile. Normally, this is initiated in early stage chemistry, manufacturing, and controls (CMC) development, then the method itself is developed and qualified for testing clinical GMP products.
In late-stage CMC development, you should monitor assay performance and, if necessary, improve and change an analytical method to ensure that it is suitable for use and meets relevant regulatory standards for future license application. You may need to transfer a method from a development site to a commercial production site. You should standardize critical reagent qualification, material stability, product specification, and so on. Analytical validation per ICH Q2R1 is required to support process validation and product licensure.
After a product is approved, the next phase is commercial method lifecycle. You should continue maintaining and monitoring assay performance by periodic review. Revalidation might be necessary in certain circumstances. A method could be identified as problematic upon OOS investigation, so you might need to replace an old analytical method with a new one, which will require postapproval change. All components come together in the workflow for an analytical lifecycle along product development from early to late stage to commercial production.
Take-Away Points: Method validation and transfer are integrated activities of analytical lifecycle management. Validation and transfer processes should be revisited if significant changes are made to a method in a lifecycle. Parameters to be validated and study design should be fit for purpose in method validation because each stage of product development might have unique requirements. Method transfer results should confirm the validation status of an analytical method in a laboratory other than the validation laboratory. To ensure method consistency between two sites, a transfer approach and design should take into account technical risks. And validation and transfer are effective activities to identify potential analytical issues (such as for the spiking case study above) and enhance our understanding of method performance.
References
1 Martin GP, et al. Proposed New USP General Chapter: The Analytical Procedure Lifecycle <1220>. US Pharmacopeial Convention: North Bethesda, MD, 2016.
2 Guidance for Industry: Process Validation: General Principles and Practices. US Food and Drug Administration: Rockville, MD, 2011.
3 ICH Q2R1: Validation of Analytical Procedures: Text and Methodology. Fed. Register 60, 1995: 11260.
Further Reading
Guidance for Industry: Analytical Procedures and Methods Validation for Drugs and Biologics. US Food and Drug Administration, Rockville, MD, 2015.
Krause SO, et al. PDA Technical Report 57: Analytical Method Validation and Transfer for Biotechnology Products. PDA: Bethesda, MD, 2012.
USP <1224>: Transfer of Analytical Procedures. US Pharmacopeial Convention: North Bethesda, MD; https://hmc.usp.org/ sites/default/files/documents/HMC/GCs-Pdfs/ c1224.pdf.
This article is based on a presentation given at the BioProcess International West meeting in San Francisco in March 2018. At the time of the presentation, Weijun Li was senior manager in the QC department at Bayer. Currently, he is director of analytical development and quality control at Allakos Inc., 975 Island Drive, Suite 201, Redwood City, CA 94065; 1-415-624-6060; [email protected].
You May Also Like


