Manufacturability Assessment: A Tool for Effective and Transparent Decision-Making and Efficient Process DevelopmentManufacturability Assessment: A Tool for Effective and Transparent Decision-Making and Efficient Process Development
 Design for manufacturing (DfM, also known as design for manufacturability) is a common approach in engineering industries when complex, multistep production processes are developed and installed to manufacture products. Adherence to DfM approaches has been prevalent for decades in the automotive, aerospace, and electronics industries, among others (1–3). Recently, a generalized manufacturability-assessment tool with strategies to weigh different aspects of manufacturing has been proposed with numerous similarities to that described herein specific to the field of bioprocess development (4). Although the specific details and design goals of a DfM approach vary by industry, general principles of manufacturability prevail throughout. They are best captured by Shankar and Jannson, who define manufacturability as “the ability to manufacture a product to obtain the desired quality and rate of production while optimizing cost” (5).
Explicit discussion about the application of DfM principles in the biotechnology industry has been far less prevalent than in other industries, perhaps due to the overwhelming number of reports detailing application of quality by design (QbD) principles to all aspects of bioprocess development (6). It also could be because the term manufacturability occasionally has been used to describe evaluation of molecular candidates’ suitability for production and development, particularly from a formulation and stability perspective (7, 8). Such systematic molecular candidate evaluation also is termed developability (9–11). The concept of manufacturability has been discussed in the context of bioprocessing with specific examples: bioproduction of Fc-fusion proteins using Escherichia coli (12), chemically defined media development for Chinese hamster ovary (CHO) cell-based production systems (13), development of an integrated perfusion bioreactor platform (14), and success factors for technology transfer in the biotechnology industry (15).

Figure 1: Schematic representation of a product life cycle and points (indicated by arrows) at which manufacturability assessments can be performed
Significant opportunity remains for application of DfM principles and approaches in the biopharmaceutical industry — including formal and detailed qualitative (16) and quantitative (5, 17) manufacturability assessment tools (18). Here, we propose a set of DfM principles specific to bioprocess development along with a semiquantitative manufacturability assessment tool that can be used to evaluate an existing or prospective process or its individual elements for their ability to meet the aforementioned DfM principles. Such tools can have applicability throughout a product’s lifecycle, from initial process development for first-in-human (FiH) trials, to process redevelopment in preparation for pivotal material production, and ultimately for continuous process improvements as part of lifecycle management. The tool is generally applicable for all aspects of process development, including cell culture, purification, and fill–finish process steps. A key feature of the assessment tool proposed is its ability to account for both the importance of projected gaps in manufacturability and corresponding effort, time, and resources required to address a given gap. We believe that this tool provides a strong foundation upon which process development programs can be designed and communicated to increase the probability of success both for individual process development teams and across an organization.
Manufacturability Principles for Bioprocessing: To evaluate the manufacturability of a bioprocess and its individual elements, a broadly applicable and predefined list of manufacturability principles must be defined. We suggest applying a list of principles characterizing manufacturable processes, each of those described further in the “Eight Principles” box.
Eight Principles of Manufacturability |
|---|
Robustness: The ability of a process to withstand or adapt to variability of inputs and maintain performance within acceptable ranges while achieving desired product quality attributes (PQAs) Simplicity: Minimization and reduction in complexity of inputs to and equipment and procedures used in the execution of a process or unit operation, including raw materials, process solutions, processing steps, and operator interventions Safety: Minimization of potential impacts on operators or the environment through design of a process that eliminates or lessens the use of hazardous chemicals or processing conditions (e.g., temperature and pressure) Standardization: The ability of a process to be executed using typical, preexisting, or off-the-shelf raw materials, equipment, and controls; also similarity of one process to others developed within an organization, company, or the industry at large Scalability: The ability of a process to execute equivalently across multiple scales with minimal adjustments to parameters required to account for scale differences (includes scale-up and scale-down) Cost of Goods: Minimization of operating expenses on a per-gram or per-dose basis. Process and Cycle Time: Minimization of time required to complete an individual unit operation and/or full process train to decrease suite occupancy and therefore increase capacity use (batches/year) Facility Fit: The ability of a process to be transferred, adjusted, and implemented into a range of anticipated manufacturing facilities and scales, especially industry-standard facilities; adaptability of a process to changes in external factors |
Methodology
General Considerations and Overall Methodology: A manufacturability assessment should be considered prerequisite to initiation of efforts to update or improve a baseline process (Figure 1). The most immediately obvious point in a project lifecycle at which a manufacturability assessment should be performed is between FiH and pivotal clinical trials, when baseline process optimization must meet additional requirements for commercialization (e.g., productivity, purity). Second, developers might consider such an evaluation during lifecycle management of a commercial process or before initiating FiH process development.
The outcome of the manufacturability assessment will be a detailed process-development plan designed to address identified manufacturability gaps specifically according to their prioritization and available time and resources projected for baseline-process redevelopment activities. Manufacturability assessment is a three-step process:
current-process evaluation
manufacturability development classification comprising determinations of gap-risk and development-difficulty ratings
process development prioritization.
Each of those steps is detailed below. Note that in each step of a manufacturability assessment, a risk-assessment team should refer to the manufacturability principles described in in the “Eight Principles” box either stepwise or holistically.
Current-Process Evaluation: The first step in manufacturability assessment is a knowledge-compilation exercise based on focused and thorough review of the current state of the process with several key inputs. Process development reports and relevant process data obtained during the history of a given process or unit operations all are important here. For cases in which platform processes have been implemented, performance history from other similar processes also could be considered as an input. For processes that have been implemented at pilot or production scales, manufacturing data from each campaign also should be compiled and considered. Information from published literature also should be considered from citations corresponding to similar molecular formats — e.g., monoclonal antibodies (MAbs), multispecifics, and so on — or similar processing steps and formats. Finally, relevant information should be compiled about a potential facility or facilities that are under consideration to be “receiving units” of a redeveloped process. The process development reports, manufacturing history, literature, and facility information all provide the foundation for proper evaluation of manufacturability and ultimately, design of an appropriate process development plan. Time and resources should be assigned accordingly to ensure that this knowledge-compilation part of the manufacturability assessment is comprehensive.
Subject-matter expertise (SME) represents the second key input type required for the current-process evaluation. Because many aspects of manufacturability are difficult to quantify, the judgment of subject-matter experts is key to identifying what aspects of a process do not meet acceptable thresholds for manufacturability. Quantifiable aspects of manufacturability, such as cost and process and cycle time, can be considered for developing more quantitatively rigorous manufacturability evaluation. SME ideally is provided by a group of people that includes members from the team responsible for process development alongside selected additional experts from outside that team. Those can include key “customers” such as a commercial manufacturing organization.
Together, the knowledge compilation and assembled SME are used to judge a current process against the manufacturability principles described in the “Eight Principles” box. The output of a current-process evaluation is an unprioritized list of manufacturability gaps to be assessed further in subsequent steps. The “Case Studies” section below details examples of such gaps in a downstream process.
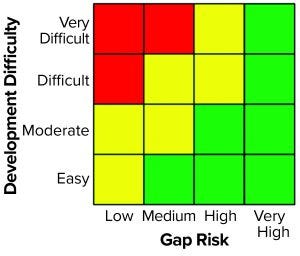
Figure 2: Manufacturability-assessment planning rubric for determining whether to perform developmental work (green = yes, yellow = maybe, red = no)
Manufacturability Risk Scoring: The next step in a manufacturability assessment is scoring to classify each risk in terms of whether process development activities should be undertaken to address identified risks from the current-process evaluation. Two separate contributions make up this semiquantitative scoring exercise: the gap-risk rating and the development-difficulty rating. Together, these ratings are used to determine how each identified manufacturability gap is classified on a manufacturability development planning rubric (Figure 2). Each of three key components — the two rating scores and the planning rubric — are discussed in greater detail below.
Gap-Risk Rating: The first step in risk scoring, a gap-risk rating is calculated according to the projected potential of a manufacturability gap to affect product quality, process robustness, and process efficiency. The gap-risk rating (GR) is calculated according to the following equation:
GR = 10(IPQ) + 5(Irob) + 5(Ieff)
where I is the impact score for product quality (PQ), process robustness (rob), and process efficiency (eff). An impact to product quality would be a significant change in an attribute that could lead to an individual lot failure due to missing a product quality specification — or more broadly, an increased risk of comparability failure as a program proceeds through development. Process robustness (see the “Eight Principles” box) is called out separately here because of the relative importance of achieving process reproducibility. Finally, the process efficiency impact score covers remaining manufacturability principles such as cost, speed, scalability, and so on. The prefactors listed in the equation above have been designed to provide the greatest weighting to product-quality impacts.
An impact score is assigned a value of 0, 1, 2, or 3 independently for each category. Note that the impact score does not express the probability that a gap will affect product quality, robustness, or efficiency. This score is meant to reflect the magnitude of impact to each category if a given manufacturability gap is not addressed during subsequent process development activities. A potentially useful approach is to ask the question, “If we don’t fix this gap, what will the impact be?” For the answer, apply an impact score of 0 if there will be no impact and scores of 1, 2, and 3 indicating low, medium, and high impacts, respectively. The specific risk-classification examples provided in our case studies illustrate how those impact levels have been assigned in practice to real gaps identified during process development programs at Sanofi.
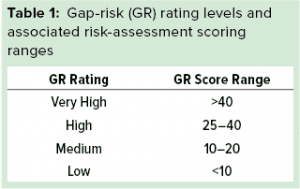 After the three impact scores are determined for a given manufacturability gap, its gap-risk rating can be calculated easily according to the equation above. Then the output of that calculation is used to assign a gap-risk rating according to the categories detailed in Table 1.
The ranges for each gap-risk rating level in Table 1 have been designed such that any gap affecting product quality has a minimum classification in the medium category. To have a very high classification, both product quality and either process robustness or efficiency must have fairly high impact scores. Of course, the gap-risk rating calculation can be customized to include more or fewer individual impact scores. Additionally, the prefactors and cutoffs for the gap-risk rating categories described herein also can be adjusted depending on the risk profile of an organization or needs of an individual development program.
Development Difficulty: Calculation of the development-difficulty rating is the second step in risk scoring. This rating is calculated based on projected technical or scientific difficulty to develop a solution for addressing a particular identified manufacturability risk together with the projected amount of time and labor resources (in full-time equivalents, FTE) required to execute the derisking process development. The development-difficulty rating (DD) is calculated according to the following equation:
DD = 10(ISci) + 5(Itime) + 5(IFTE)
where I is the impact score for scientific or technical feasibility (Sci), time available (time), and available labor (FTE). The scientific-feasibility impact factor can be determined by combining information gained from development of similar processes, platform knowledge, scientific literature, and SME. In this second equation, the time and FTE contributions are considered separately because time and resource requirements are often but not always correlated. For example, a manufacturability gap related to product stability could require significant time to evaluate successful mitigation but few labor resources to execute the study and associated analyses.
It is important to consider that the impact scores for time and FTEs are calculated according to the availability of those resources. Projected time available could be determined based on the time elapsed until a process change must be implemented before the next phase of clinical development. Projected FTE availability could be determined based on routine allocation of resources for a given phase or cycle of process development — or by explicit guidance from resource-owning management.
As with gap-risk analysis above, these impact scores can be assigned a value of 0, 1, 2, or 3. For development difficulty, the score is meant to evaluate the difficulty of successfully mitigating a particular manufacturability risk given projected constraints imposed by technical, time, and FTE challenges. The development-difficulty impact scores for all three subcategories should correlate positively with one another, although their magnitudes can differ. For scientific feasibility, an impact score of 0 would indicate an absence of perceived technical challenges (low difficulty), with scores of 1, 2, and 3 reflecting technical challenges increasing from low to moderate to high, respectively. The specific risk-classification case studies provided below illustrate how these impact levels were assigned in practice to real gaps identified during process development programs at Sanofi.
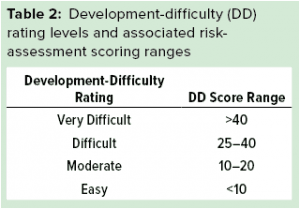 After the three impact scores are determined for a given manufacturability gap, the development-difficulty rating can be calculated easily according to the second equation above. Then the output of this calculation is used to assign the development-difficulty rating according to the categories detailed in Table 2.
The development-difficulty rating calculation also can be customized to include more or fewer individual impact scores. Additionally, the prefactors and cutoffs for the categories described herein also can be adjusted. The prefactors listed in the second equation have been designed to provide equal weighting to scientific feasibility and projected resource constraints (the combination of time- and FTE-related difficulty). Ranges for the development-difficulty rating levels in Table 2 are designed to give all gaps that are considered to be technically very difficult a minimum classification in the difficult category. Finally, to have a very difficult classification, both technical feasibility and resource-related impact scores must contribute strongly.
Process Development Prioritization: Gap-risk and development-difficulty ratings can be used together to help guide process development planning and address identified manufacturability gaps. We developed a manufacturability assessment planning rubric to aid with classification and prioritization for the range of gaps that can arise (Figure 2).
The planning rubric is color coded. The rubric should be a helpful visual tool to convey the magnitude of additional time/labor projected to mitigate a given risk. Green indicates that process development should be performed to address an identified manufacturability gap, either because that gap is significant or the difficulty of closing it is relatively low (or both, in some cases). Red indicates that development should not be performed because the return on investment would be insufficient. Yellow indicates that the path forward is not definitive. In such cases, a team could consider performing a limited set of experiments to assess the scientific feasibility of an identified gap better and decrease uncertainty in the projected development-difficulty rating — and correspondingly reassess whether further development should be performed to mitigate the risk. Alternatively, a company could focus resources first on closing green-category gaps and then, should time allow (e.g., with changing clinical timelines), allocate additional resources to address those scored yellow. Finally, the color of the very high gap-risk rating column was designed deliberately to be solid green because some manufacturability risks can be fatal to the long-term viability of a process if they are left unaddressed.
Altogether, the manufacturability assessment is completed for a given process by determining the impact scores and corresponding planning rubric classifications iteratively for each identified manufacturability risk. The above-described process might seem complex or cumbersome at first, but once its framework is understood, process-SME teams typically can work quickly to identify gaps and fill out associated heatmaps. It is important to note that the estimated ratings for both gap risk and development difficulty are estimates. Therefore, development teams should not be overly concerned with achieving the highest level of accuracy because some level of uncertainty is inherent and should be expected.

Figure 3: Process architecture for purification of the multispecific antibody assessed in case studies
Case Studies
We have compiled several case studies to illustrate application of manufacturability assessment based on evaluations performed before redevelopment of the purification process for a multispecific antibody. The purification process flow generally resembles that of a typical antibody purification (Figure 3).
Case Study 1 — Protein A Eluate Dilution: A potential aggregation liability was identified before process development began, so the FiH purification process for the multispecific antibody incorporated a dilution step of eluate from the protein A capture column to decrease the concentration of the intermediate pool. The resulting increase in pool volume was identified as a manufacturability risk for later phases in development based on facility-fit considerations (intermediate vessel sizes) and expanded processing times for the nonintensive postcapture steps. We used our manufacturability assessment tool rigorously to classify this risk.

For the gap-risk rating of each impact factor, we asked what would happen if we did not mitigate the manufacturability risk of to the protein A eluate dilution. Table 3 summarizes the scoring outcome for this case study. For product-quality impact, we relied on process knowledge gained during FiH clinical-batch execution. Specifically, aggregate increases were observed during ultrafiltration and diafiltration (UF/DF), suggesting a molecular sensitivity to that process step. Because the magnitude of the effect was relatively small (~0.5–1.0%), we assigned a product-quality impact score (IPQ) of 1.
For the process robustness impact factor (Irob), we assigned a score of 0 because omitting the dilution step actually could decrease process robustness because dilution normalized variability in the protein A eluate pool concentration. Finally, we assigned the process efficiency impact factor (Ieff) a value of 3 because the significant dilution (>2×) created a risk that process intermediates would be unable to fit within intermediate vessels at the late-stage manufacturing facility while also increasing the processing time of each postcapture flow-through unit operation by about twofold. Combining these impact factors according to the first equation above leads to a gap-risk rating of high (25).
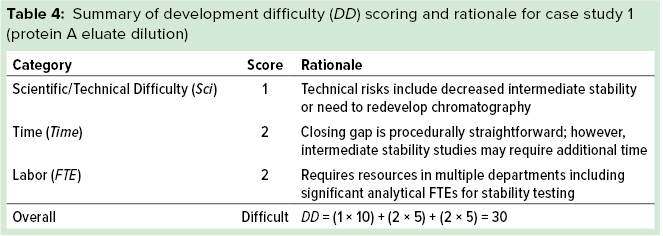
For the development-difficulty rating, we used process knowledge gained during FiH development to aid in our assessment. It is important to note that although a potential liability had been identified before FiH process development began, no data from initial development indicated that dilution was required to achieve acceptable intermediate stabilities. Therefore, we assigned the scientific feasibility impact factor (ISci) a score of 1 because of the potential need to redevelop postcapture steps that were developed to perform at lower protein concentrations, leaving a residual risk that omitting the dilution could lead to decreased intermediate stability. We assigned the time impact factor (Itime) a score of 1 because experiments could be conducted within the allotted process redevelopment timeline and assigned the FTE impact factor (IFTE) a score of 2 because significant product-quality analyses would be required, which could strain the limited analytical resources allocated to support the project. Combining these impact factors according to the second equation above gives a development-difficulty rating of difficult. Table 4 summarizes the development-difficulty scoring for this case study.
We used the gap-risk and development-difficulty ratings as inputs into our planning rubric, which returned a yellow score indicating that development to mitigate the risk should be considered. Figure 4 shows the complete manufacturability risk-assessment scoring for this protein A eluate dilution step.
During the project and process development in question, preliminary low-resource experiments were executed to assess potential stability or process performance consequences from omission of the dilution. When the results of these experiments proved encouraging, we reclassified the gap-risk rating to green (medium), and this manufacturability risk was fully mitigated before process redevelopment was final. That change in the manufacturability risk rating is indicated by the arrow on the manufacturability risk rubric in Figure 4.

Figure 4: Detailed scoring assessment for case study 1 (protein A eluate dilution manufacturability risk); arrow indicates an assessment-scoring change after preliminary data obtained from testing undiluted intermediate.
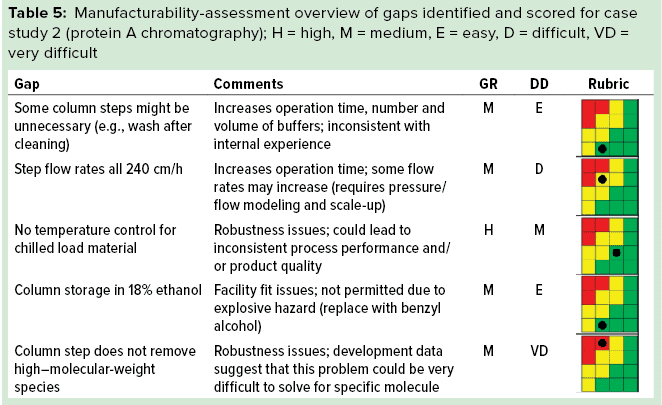
Case Study 2 — Protein A Chromatography: To illustrate how the manufacturability risks could be evaluated for an entire process step, Table 5 includes the risks we identified for the protein A chromatography step overall with an overview of our manufacturability-assessment outcomes for this case study.
For example, we identified that the protein A load (clarified harvest) was allowed to warm passively throughout the column operation, leading to potential variability from run to run. We estimated this at a high gap-risk rating primarily because of the potential effects on product quality (host-cell protein clearance, protein A leachate impurity levels) and process efficiency (step recovery). Development difficulty was moderate because the team projected that minor facility modifications would be required to achieve the desired warming rates before processing. This affected the development-difficulty score primarily through the time impact factor because facility upgrade and validation could have become rate-limiting in extreme circumstances. All these ratings led to an overall green score, and the development and facility upgrade activities were performed to mitigate the manufacturability risk.
In a second example, we considered the potential to reoptimize the protein A step to remove (or minimize the generation of) aggregates. In this case, the gap-risk rating was medium, primarily because the polishing chromatography steps were known to have a strong capacity to remove aggregates. Additionally, the development-difficulty rating was high because existing data suggested there was little opportunity to improve the protein A step with respect to aggregates, and the corresponding resource requirements to achieve such improvements were high. Overall, that led to a red score, and process development in this area was not pursued.
 Facilitating Decision-Making
Above we describe an overall approach for assessing manufacturability of a product by identifying areas of focus for related process redevelopment activities within a resource-constrained environment. The approach uses manufacturability categories to identify individual risks, a risk-assessment scoring system to assess each of those according to the perceived size of the manufacturability gap and the difficulty of addressing it, and a planning rubric to help guide prioritization.
This assessment tool could prove to be helpful for process development teams defining their process redevelopment work packages and communicating overall manufacturability risk levels and mitigation approaches. Similarly, this allows for project stakeholders and senior management to understand more clearly the manufacturability risks associated with a given process and, correspondingly, what risks are assumed or mitigated by providing the development team with more or less time and FTEs to address identified risks. Separate consideration of manufacturability gaps and their severity from technical and organizational constraints is a key, deliberate feature of this manufacturability assessment tool that should help facilitate prioritization and clarify discussions among project teams, stakeholders, and resource-owners.
We anticipate that taking a similar approach, with application-specific customization, should prove useful for other groups within the biotechnology industry (e.g., developability, deviceability, and technology transfer) as well as across other industries (e.g., classical pharmaceuticals, energy, and chemicals) in which risk-mitigating development activities can occur in a time-bound, resource-constrained environment.
Acknowledgments
We acknowledge Kripa Ram and Nihal Tugcu for their review and comments and Jon Forstrom for discussions on manufacturability.
References
1 Ziemke MC, Spann MS. Concurrent Engineering’s Roots in the World War II Era. Concurrent Engineering. Parsaei HR, Sullivan WG, Eds. Springer: Boston, MA, 1993: 24–41.
2 Tracey J. Chapter 9: Drivers and Challenges for US Aerospace Manufacturing. New Directions in Manufacturing: Report of a Workshop. Washington DC: The National Academies Press, 2004: 49–54.
3 Sanders TJ, et al. Integrated Circuit Design for Manufacturing Through Statistical Simulation of Process Steps. IEEE Transactions on Semiconductor Manufacturing 5, 1992: 368–372; https://ieeexplore.ieee.org/document/175369.
4 Wall E, et al. Development of a Weighting Strategy for a Manufacturability Assessment. Procedia Comp. Sci. 153, 2019: 309–316.
5 Shankar SR, Jansson DG. A Generalized Methodology for Evaluating Manufacturability. Concurrent Engineering. Parsaei HR, Sullivan WG, Eds. Springer: Boston, MA, 1993: 248–263.
6 Rathore AS. Roadmap for Implementation of Quality By Design (QbD) for Biotechnology Products. Trends Biotechnol. 27(9) 2009: 546–553; https://doi.org/10.1016/j.tibtech.2009.06.006.
7 Yang Y, et al. Multi-Criteria Manufacturability Indices for Ranking High-Concentration Monoclonal Antibody Formulations. Biotechnol. Bioeng. 114(9) 2017: 2043–2056; https://doi.org/10.1002/bit.26329.
8 Conley GP, et al. Evaluation of Protein Engineering and Process Optimization Approaches to Enhance Antibody Drug Manufacturability. Biotechnol. Bioengin. 108(11) 2010: 2634–2642; https://doi.org/10.1002/bit.23220.
9 Coffman J, et al. Highland Games: A Benchmarking Exercise in Predicting Biophysical and Drug Properties of Monoclonal Antibodies from Amino Acid Sequences. Biotechnol. Bioeng. 117(7) 2020: 2100–2115; https://doi.org/10.1002/bit.27349.
10 Lauer TM, et al. Developability Index: A Rapid In Silico Tool for the Screening of Antibody Aggregation Propensity. J. Pharm. Sci. 101(1) 2012: 102–115; https://doi.org/10.1002/jps.22758.
11 Yang X, et al. Developability Studies Before Initiation of Process Development. mAbs 5(5) 2013: 787–794; https://dx.doi.org/10.4161%2Fmabs.25269.
12 Lin H, et al. Effect of Manufacturability Considerations in Facilitating Efficient Development and Transfer of an Escherichia coli Process Producing Fc-Fusion Proteins. AIChE National Meeting: New Approaches in Upstream Bioprocessing — Development and Manufacturing. Philadelphia, PA, 2008; https://www.aiche.org/conferences/aiche-annual-meeting/2008/proceeding/paper/432d-effect-manufacturability-considerations-facilitating-efficient-development-and-transfer.
13 Ling WLW, et al. Development and manufacturability Assessment of Chemically-Defined Medium for the Production of Protein Therapeutics in CHO Cells. Biotechnol. Prog. 31, 2015: 1163–1171.
14 Walther J, et al. Overcoming Process Intensification Challenges to Deliver a Manufacturable and Competitive Integrated Continuous Biomanufacturing Platform. Cell Culture Engineering XV. Kiss R, Harcum S, Chalmers J, Eds. ECI Symposium Series 2016; https://dc.engconfintl.org/cellculture_xv/16.
15 Concha G. Metrics and Best Practices in Technology Transfer Between R&D and Manufacturing in the Pharmaceutical and Biotech Industry. MIT Sloan School of Management: Cambridge, MA, 1995.
16 Brissaud D, Tichkiewitch S. Innovation and Manufacturability Analysis in an Integrated Design Context. Computers in Industry 43(2) 2000: 111–121; https://dx.doi.org/10.1016/S0166-3615(00)00061-0.
17 Gupta SK, et al. Automated Manufacturability Analysis: A Survey. Res. Eng. Design 9, 1997: 168–190; https://doi.org/10.1007/BF01596601.
18 Brower KP, et al. Manufacturability Assessment Tool for Effective Decision-Making and Process Development: Development and Applications. American Chemical Society National Meeting: Biotechnology Division. March 2016, San Diego, CA; https://www.acs.org/content/dam/acsorg/meetings/national-meetings/program-book/2016-san-diego.pdf.
Corresponding author Kevin P. Brower is head of purification development; Rohan A. Patil and Jason L. Walther are associate directors of purification process development, Dhiral A. Shah is a senior purification scientist, and at the time of this writing, Tarl A. Vetter (now at Pfizer) was senior purification scientist at Sanofi Biologics Development, 31 New York Avenue, Framingham, MA 01701; 1-508-271-4539, fax 1-508-271-3452; [email protected]. Veena Warikoo is head of biomanufacturing for tomorrow at Genentech (a member of the Roche group) in South San Francisco, CA. And Konstantin Konstantinov is executive vice president of manufacturing and process sciences at Codiak BioSciences in Cambridge, MA. The authors declare no conflicts of interest.
You May Also Like


