Accelerating Purification Process Development of an Early Phase MAb with High-Throughput AutomationAccelerating Purification Process Development of an Early Phase MAb with High-Throughput Automation
Purification process development of monoclonal antibodies (MAbs) has traditionally relied on a strategic trial-and-error approach using small-scale preparative chromatography for determining the operational parameters that would be optimal for clinical manufacturing. Doing so is demanding of both time and resources, and it thus restricts the number of early phase therapeutic drug molecules that can be evaluated in a company's development pipeline toward clinical trials. With high-throughput (HT) technologies incorporated at key points in development and laboratory operations, an operating space for in-process conditions can be quickly defined and allow for significant improvement in product and process knowledge before scaled-up experiments. HT work allows for rapid process development of a therapeutic MAb while minimizing material requirements for early stage development and thus overall costs. As these technologies continue to emerge, the HT approach will become increasingly powerful and be applied to downstream process development of other biologics.
PRODUCT FOCUS: MONOCLONAL ANTIBODIES
PROCESS FOCUS: DOWNSTREAM PROCESSING
WHO SHOULD READ: PROCESS DEVELOPMENT AND ANALYTICAL
KEYWORDS: LIQUID HANDLING, SCALE-UP, CHROMATOGRAPHY, HOST-CELL PROTEINS, DNA ANALYSIS, UV-VIS SPECTROSCOPY
LEVEL: INTERMEDIATE
Part One of this technical report (BioProcess Int. 12(3) 2014: 48–52) provided background and listed materials and methods for the study. Here we describe our results and conclusions.
Results
Solubility Mapping: We mapped MAb solubility to determine the optimal buffer system for keeping the drug product in its monomeric state over a broad range of pH and buffer concentrations. The pH range we specifically aimed for in this study is 3.0–6.5, an operating range compatible with protein A (pro-A) capture chromatography, viral inactivation and/or neutralization, and subsequent polishing. We chose four different buffer systems for this study — buffers A, B, C, and D — based on their suitable buffering capacities over that desired pH range (3.0–6.5).
Solubility mapping was a two-stage process: selection of the top two lead buffer systems and fine-tuned solubility analysis at a low pH range for those two optimal systems. Our goal for the second study was to identify the exact pH below which the MAb molecule begins a significant loss of stability. Such information is valuable for viral inactivation and/or neutralization studies. Figure 3 and 4 show the results of both analyses. As expected, the MAb exhibits least stability and tends to aggregate at low pH values and high buffer concentrations (high conductivities). However, buffers C and D offered the best stability for this MAb at a wider range of buffer concentrations and pH values than the other two buffers we tested.

Figure 3:
HT analytics greatly accelerated the processing time required to get results. As opposed to the traditional 20–25 minutes per sample, the ultraperformance liquid chromatography (UPLC)–based size-exclusion chromatographic (SEC) analysis took only four to six minutes per sample and provided a fast and effective comparison of MAb stability in various buffers. A 96-well plate can be analyzed in six to seven hours by UPLC-SEC, whereas 96 samples would have taken >40 hours using conventional high-performance liquid chromatography (HPLC)-SEC.
Figure 4 shows that the MAb's stability also varies significantly in buffers C and D. Both are dual-component buffers (C1 and C2; D1 and D2), and we tested them for the effects of different ratios of those buffer components on MAb solubility at low pH, as indicated. With buffer C, significant aggregation (monomer <90%) occurred at pH <3.5, whereas with buffer D, aggregation is detected at pH <3.3. In buffer C, component C2 played a major role in causing MAb aggregation. In buffer D, by contrast, both components played a role in causing aggregation. Overall, because of the MAb's greater stability over a broader pH range in buffer D, we decided to pursue that system for further development of the capture step.
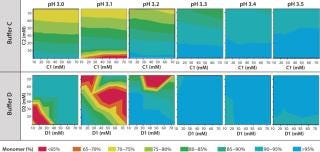
Figure 4:
Protein A Chromatography and Viral Inactivation: Our extensive experience with pro-A chromatography provided an immediate foundation for this process and allowed us to quickly optimize the final conditions for capture. Based on results obtained from the HT solubility mapping data, we used buffer D for all wash and elution steps, with some optimization of pH and conductivities. Table 1 summarizes the product quality obtained after the protein A capture step. Effective viral inactivation occurs when protein A eluate is held at pH values <4 (31,32,33). To align our pro-A elution conditions with the viral inactivation (VI) step, we chose pH values for the wash and elution buffers to maintain an eluate pool pH that would be suitable for VI while minimizing elution volume. Table 1 also summarizes product- and process-related purity levels after protein A capture and VI/filtration.
Table 1
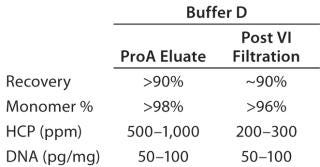
Table 1:
HT Development of Intermediate Polishing: Cation-exchange (CEX) chromatography in bind and elute mode provides intermediate polishing of the MAb bulk. We incorporated HT automation into this step for a quick screen of multiple resins and to obtain a broad range of knowledge about the process parameters.
Resin Screening Based on Dynamic Binding Capacity (DBC): For this study, we chose eight commercially available CEX resins representing a wide array of physiochemical properties (bead size, pore size, and charge distribution). Using the 500-µL Atoll column format on the liquid-handling robot, we screened the resins for DBC of our MAb using buffer D at pH 5.5. Figure 5A shows breakthrough curves used to estimate DBC. Based on those results, we grouped the resins into three categories: high (resins 1–3), medium (resins 4–6), and low (resins 7 and 8) DBC. The two resins with the lowest DBC for this MAb were weak cation exchangers; all of the strong cation exchangers had medium to high binding capacities.
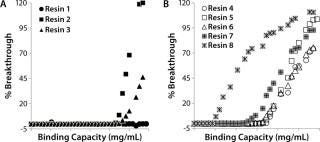
Figure 5a:
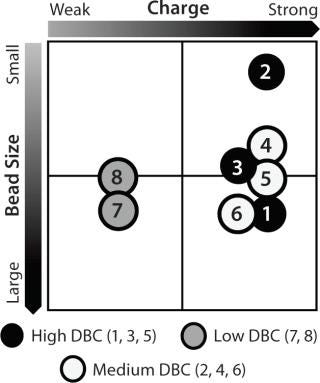
Figure 5b:
Notably, the resin with the highest DBC incorporated dextran chemistry on its surface. According to the manufacturer and other independent sources, that surface chemistry leads to high ligand density that often results in high binding capacities (34,35,36). However, that can be at the expense of resolution between product and impurities (34,35,36). Based on our results, we selected all the resins that gave us a high DBC and one that yielded a medium DBC. We discarded the other medium-DBC resins because of previous experiences with them and the challenges they posed during scale-up.
Screening for Wash Conditions: Our batch-mode chromatography wash-condition screening used filter plates packed with the lead resins. We created a range of wash buffer combinations varying in buffer conductivity and pH (Figure 6) before the purification process. Then we subjected the filter plate to the chromatographic purification process: charge, load (at maximum binding capacity), chase, wash (variable), elute, strip, and regenerate. Depending on the stringency of the wash condition, MAb loaded onto the resin either remained bound or eluted off during the wash step.

Figure 6:
Figure 7A graphically represents%MAb (normalized to the amount loaded) that elutes at each of chromatography step. The deep blue color represents conditions at which no product elutes; the deep red color represents conditions at which the buffer is strong enough to elute the protein off the resin. For resin 2, we observed some product loss in the chase step, indicating that interaction between the product and resin 2 is not strong at pH 5.5, which leads to lower recoveries during elution. The other resins (1, 3, and 4) did not exhibit such behavior.
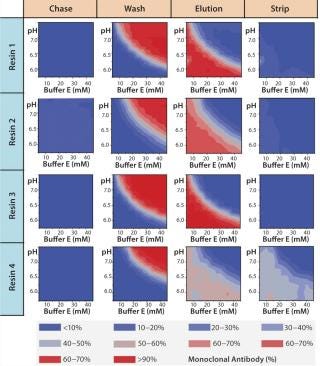
Figure 7a:
For all resins, as expected, our MAb elutes off the resin during the wash step under high conductivity and pH conditions. The high-resolution wash contour maps in Figure 7B indicate conditions at which the MAb is subject to the most stringent wash (contour line along the deep blue color). Potentially good wash conditions for each of the respective resins shown are the pH and conductivity values adjacent to the line of demarcation (as denoted by “×” symbols in Figure 7B). For those selected conditions, we analyzed eluates for host-cell protein (HCP) content. Figure 8 shows that resin 4 removed the highest amount of HCP from the load at all pH values tested. Based on its acceptable DBC and robust ability to clear impurities, we chose that resin for further evaluation.

Figure 7b:
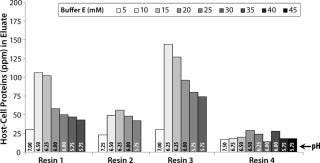
Figure 8:
Screening for Elution Condition: Having identified resin 4 as the lead choice, we evaluated elution conditions using HT screening capabilities. As in our wash studies, we created a new range of elution buffers by incorporating a salt species, varying buffer concentration along the x axis and that of salt species F along the y axis. We prepared a 96-well filter plate packed with 50 µL of resin 4 and then subjected it to a standard batch-mode purification protocol: charge, equilibrate, load, chase, wash, elute (variable), strip, sanitize, and store.
Based on the results shown above and in Figure 7B, we chose 10mM buffer E at pH 6.75 as the wash buffer for this study. After the wash step, we applied different elution buffers to the resin plate, having prepared them by incorporating different amounts of buffer E and salt species F at pH 7.0. Figure 9 illustrates the percent MAb species (normalized to the amount loaded) that elutes at each chromatography step. As expected for a CEX step, the MAb's elution profile strongly correlates with the buffer's ionic strength. At high ionic strengths (>50mM buffer E and >20mM species F), the MAb elutes rapidly in low column volumes (CVs); at very low ionic strengths (<30mM buffer E and <5mM species F), the MAb does not fully elute even with 12 CVs of the elution buffer.
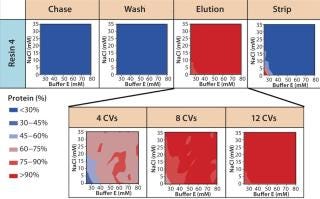
Figure 9:
Preparative-Scale Chromatography — Defining Postload Wash Conditions: Experiments detailed above defined a general operating space of buffer E for resin 4 wash conditions. To identify the most stringent wash pH that could be used at 10mM buffer E, we loaded resin 4 to capacity and applied a pH step elution incrementally from pH 6.6 to 7.2 (Figure 10). At pH 6.9, we observed that our product began to elute from the resin, indicating that pH 6.8 would be the upper limit for washing. Studies subsequently performed demonstrated that a minimum of 7 CVs of wash was required to obtain desired purity levels in the eluate. Our final recommendation for wash was 7 CVs of 10 mM buffer E at pH 6.6 ± 0.1.
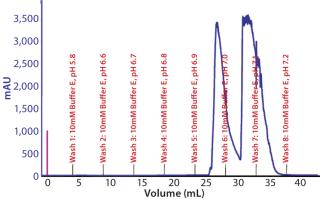
Figure 10:
Preparative-Scale Chromatography — Defining Elution Conditions: We had to develop elution conditions to maximize clearance of high– molecular-weight (HMW) impurities and Chinese hamster ovary host-cell proteins (CHO-HCP) while maintaining high yield and low elution volume. Data from the HT screening study identified the operating space in which our MAb elutes from resin 4, so we used that as a starting point for final condition optimization.
Based on the optimal elution conditions identified using HT studies (Figure 7A and 9), we performed preparative-scale chromatography with and without the presence of salt species F. The representative chromatograms in Figure 11 were obtained using salt species F in the elution buffer. We fractionated the elutions to evaluated them for HMW and CHO-HCP clearance. Based on those results, we identified a peak collection criterion and made a final recommendation to use 25mM buffer E + 20mM species F at pH 6.8 ± 0.2 as the elution buffer. Using those conditions, the CEX step cleared the CHO-HCP to <40 ppm and HMW aggregates to <2% (Table 2). Based on the knowledge we have obtained using these HT studies, a very small number of preparative-scale runs (<10 runs) were sufficient to finalize the conditions and obtain desired purity levels within acceptable column volumes.
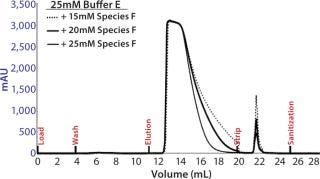
Figure 11:
Table 2
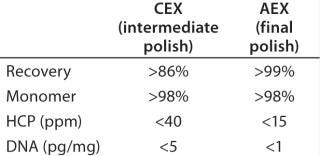
Table 2:
Final Polishing (Anion-Exchange Chromatography): We used preparative-scale anion-exchange (AEX) chromatography in flow-through mode for final polishing of the MAb obtained after the CEX intermediate-polishing step. This final step is designed to remove impurities that are more acidic than the product (e.g., viruses, DNA, CHO-HCPs, and residual protein A). Effective separation of impurities from the product occurs at appropriate pH and ionic strength conditions, when impurities bind to the AEX and antibody remains in the flow-through fraction. The elution pH from the CEX polishing step was in line with this final polishing step. Table 2 lists final purity levels we obtained.
Discussion
The primary goal of purification process development for MAb products is to achieve economically and efficiently the desired purity levels that are appropriate to the clinical studies for which it is intended.
Capture: Typical downstream processes for MAbs include capture chromatography followed by one to three chromatographic polishing steps. Selecting the right buffers for each of those steps plays a critical role in optimization, if not determining the success or failure of the entire development process. To conduct a meaningful evaluation, we subjected our product to stability/solubility analysis with different buffers. HT automation technologies — in the form of Tecan liquid handling systems — allowed us to create a broad range of buffers (96 different combinations of pH and conductivity for each).
Product stability/solubility testing requires buffer exchange. Traditionally, this is accomplished through either dialysis, desalting chromatography, or membrane-based concentration/buffer exchange with tangential flow filtration (TFF) or centrifugation. Each buffer exchange option poses significant limitations: time, volumes required, and potential stress on the antibody (due to concentration steps). HT plate-based buffer exchange, however, allowed us to use modest amounts of product (80 µL per condition) while giving us the ability to process a large number of samples in a very short time (~15 m/plate).
Large numbers of samples require fast and efficient methods of analyzing those samples with desired assays. Here, we evaluated aggregation and degradation of our product, and the HT capabilities of Waters UPLC-based SEC analysis allowed us to analyze samples within ~6.5 h (~4 m/run), whereas a traditional HPLC-based SEC analysis would have required ~40 h (~25 m/run) to process the same number of samples. HT allowed for a greater number of experiments to be executed and therefore contributed to both the scope of our experiments and the strength of the resulting data (Figure 3 and 4). Building on the solubility mapping data, we rapidly identified wash and elution conditions for the pro-A–based capture step, with minor product specific alterations to wash and elution pH values.
Intermediate Polishing: After capture, ion-exchange chromatography (IEX) polishing steps are commonly applied in MAb purification processes because of their high capacity, selectivity, robust operations, and well-understood principles (17, 37, 38). Optimization of such steps typically involves resin screening, selection of pH, and determining counterion concentrations for loading, washing, and elution. Time and material constraints associated with preparative-scale columns often preclude evaluating more than 20–50 conditions during early stages of process development. To overcome that limitation, we used a HT screening system based on robotic liquid handling, miniature “robo-columns,” and 96-well filter plates to evaluate different operating conditions.
The miniature columns allowed us to screen eight different CEX resins simultaneously while requiring minimal quantities of both and product stream than traditional preparative-scale screening would have used. We further defined wash and elution conditions on the lead resins using batch-mode chromatography. The simplicity of executing batch-binding experiments, the modest resin-volume requirements, and the ease of running multiple test conditions in parallel enabled us to screen a broad experimental space with small amounts of product (16). Used during early development stages, this method can quickly provide information about the thermodynamics of product–resin interactions, ability of resins to distinguish between product and impurities, and kinetics of those interactions (39,40,41)
Scientists in the biotech industry often report on significant discrepancies in results obtained using batch-mode and column-based chromatographies (16, 42). Those are particularly pronounced in the case of HT batch-binding experiments, in which resin volumes are very small. Although dynamics of agitation and mixing, contact times, and equilibrium kinetics can play crucial roles in such discrepancies, the importance of phase-volume ratio should not be overlooked. We noticed during our experiments that when packing filter plates with a desired resin, users must proceed with extreme caution to ensure that the resin beds in all wells are uniformly packed. While using vacuum-based plate-packing instruments (e.g., Atoll's ResiQuot device) in particular, it is easy to trap an air bubble as large as 10 µL in the bed if the instrument's vacuum gauge is not optimized. That may not be visible from the top, so it can easily go unnoticed during packing. Depending on whether or not an air bubble is trapped, 10-µL void space in a 50-µL resin bed can cause a 20% variation in results obtained. For more accurate results, users must exhibit extreme diligence while packing such plates and make sure that they are free of errors.
Traditional methods of establishing wash and elution buffer conditions for IEX resins require multiple chromatography runs with pH and conductivity gradients. For each resin, the HT experimental design we created using 96-well filter plates (Figure 7) is equivalent to 20 individual gradient runs (12 pH gradients and eight counterion gradients), each of which would take two to three hours for a total of 40–60 h. However, executing the experiment in HT format took only about five hours, including UV data analysis.
Using the resulting UV data, we could readily map an operating space for this CEX step that defines the contours for the extent of protein elution with respect to the strength of the wash and elution buffers (Figure 7). As expected, the wash/elution profile for our MAb strongly correlated with the buffer pH and counterion concentration with all four lead CEX resins tested (Figure 7 and 9). The mass balance achieved (>95%) for all experiments indicated excellent recovery of the antibody in all cases, with no unintended irreversible binding to skew the data. Generating and analyzing such a large amount of data in one single experiment provided us with a wealth of information on our MAb's interaction with each resin tested. Within a chosen operating space, validation experiments using preparative-scale chromatography clearly confirmed that results we obtained using HT plate-based batch chromatography were accurate and scalable.
Because the CEX step is aimed primarily at removing product- and process-related impurities (e.g., CHO-HCPs), we estimated resin selectivity during the separation by analyzing the load and elution fractions. Selectively choosing samples along the contour line of interest minimized the number of samples to be processed, and HT capabilities of the CHO-HCP ELISA allowed us to complete this analysis within four hours.
Based on DBC, product–resin interaction, and the ability to remove impurities, we identified one leading candidate from a selection of eight resins tested. Then we designed a screening study to evaluate elution conditions both with and without salt and mapped the resulting data with contour plots as with the wash studies we conducted earlier. The resulting maps again showed a strong correlation between ionic strength and the MAb's elution profile.
Validation experiments at preparative scale confirmed those observations (Figure 11). At high ionic strengths, the antibody elutes sharply in few CVs, whereas at very low ionic strengths it does not elute within a desired number of CVs appropriate for manufacturing suite capabilities. However, using a small number of preparative-scale chromatography runs (<10), we finalized the entire purification protocol for CEX intermediate polishing of our product.
Final Polishing: Finally, we evaluated AEX chromatography in flow-through mode for final MAb polishing. This step is designed to remove impurities that are more acidic than the product (43,44,45,46,47,48). At appropriate pH and ionic-strength conditions, impurities are removed from the feed stream by adsorption to an AEX matrix. With the perspective of our previous experience, we carried out a very small number of studies to determine the capacity of the AEX matrix and analyze the flow-through for all remaining trace impurities. As Table 2 shows, we obtained a high-quality product with acceptable levels of trace impurities at the end of this purification process.
A Smart Approach to HT
We have applied current and emerging HT technologies at key points in development to accelerate our work flow and achieve optimal product purity and yield at a minimized cost. In addition to increasing speed and reducing cost, this strategy also allowed us to establish a broad database of knowledge for in-process conditions and make informed choices for final recommendations. Generating a large amount of information required fast and efficient ways to analyze data. Complementing our development work with HT capabilities in analytics has greatly helped us accelerate downstream process development.
Although HT technologies can assist immensely in automating early stage purification development, we must note that this approach is not a substitute for data generated using appropriately designed preparative chromatography. Instead, HT technologies can be inserted into general laboratory operation wherever most appropriate. Thus they can be used to define larger operating spaces for development and to provide greater process knowledge before preparative-scale laboratory experiments. As a result, the number of experimental runs at preparative scale can be minimized while process knowledge is maximized.
Author Details
Lead and corresponding authors Srinivas Chollangi (scientist) and Neil E. Jaffe (research investigator) contributed equally to this work; Hui Cai is a scientist I, Amanda Bell is an associate research scientist II, Krina Patel is a scientist II, Mark Fischl is an associate scientist I, Reb J. Russell is site director, Kuang-Chuan Cheng is associate director, and Michelle-Jue Wang is group leader, all in biologics development at Bristol-Myers Squibb, 519 Route 173 West, Bloomsbury, NJ 08804; 1-978-784-6248, fax 1-978-784-6639; http://[email protected], http://[email protected].
REFERENCES
1.) Coffman, JL, JF Kramarczyk, and BD. Kelley. 2008. High-Throughput Screening of Chromatographic Separations: 1, Method Development and Column Modeling. Biotechnol. Bioeng. 100:605-618.
2.) Kelley, BD. 2008. High-Throughput Screening of Chromatographic Separations: 4, Ion-Exchange. Biotechnol. Bioeng. 100:950-963.
3.) Brorson, K. 2003. Bracketed Generic Inactivation of Rodent Retroviruses By Low pH Treatment for Monoclonal Antibodies and Recombinant Proteins. Biotechnol. Bioeng. 82:321-329.
4.) Abujoub, A, and A Shepherd. 2001.. Factors Affecting the Kinetics of Xenotropic Murine Leukemia Virus Inactivation By Low pH: The Role of pH Range, Temperature, Protein Concentration and Product.
5.) Reindal, K. 2001.. Generic Approach to Viral Clearance Studies.
6.) Bowes, BD. 2009. Protein Adsorption and Transport in Dextran-Modified Ion-Exchange Media, 1: Adsorption. J. Chromatogr. A 1216:7774-7784 .
7.) Bowes, BD, and AM. Lenhoff. 2011. Protein Adsorption and Transport in Dextran-503 Modified Ion-Exchange Media, 3: Effects of Resin Charge Density and Dextran Content on Adsorption and Intraparticle Uptake. J. Chromatogr. A 1218:7180-7188.
8.) Bowes, BD, and AM. Lenhoff. 2011. Protein Adsorption and Transport in Dextran-Modified Ion-Exchange Media, 2: Intraparticle Uptake and Column Breakthrough. J. Chromatogr. A 1218:4698-4708.
9.) Roos, PH. 1999. Ion Exchange Chromatography. J. Chromatogr. Libr. 61:3-88.
10.) Sofer, GH. 1997.Handbook of Process Chromatography: A Guide to Optimization, Scale Up and Validation, Academic Press, San Diego.
11.) Brumbaugh, EE, and GK. Ackers. 1971. Molecular Sieve Studies of Interacting Protein Systems, 7: Direct Optical Scanning Method for Ligand-Macromolecule Binding Studies. Analyt. Biochem. 41:543-559.
12.) Scopes, R. 1982.Protein Purification Principles and Practice, Springer-Verlag, New York:75-101.
13.) Shepard, CCT. 1949. The Chromatography of Proteins: The Effect of Salt Concentration and pH on the adsorption of Proteins to Silica Gels. Discussions of Faraday Society 7:275-283.
14.) Bergander, T. 2008. High-Throughput Process Development: Determination of Dynamic Binding Capacity Using Microtiter Filter Plates Filled with Chromatography Resin. Biotechnol. Progr. 24:632-639.
15.) Gagnon, P. Shukla, AA, MR and S 2006.Polishing Methods for Monoclonal IgG PurificationProcess Scale Bioseparations for the Biopharmaceutical Industry, CRC Press, Boca Raton:491-505.
16.) Curtis, S. 2003. Generic/Matrix Evaluation of SV40 Clearance By Anion Exchange Chromatography in Flow-Through Mode. Biotechnol. Bioeng. 84:179-186.
17.) Zhou, JX. 2008. Viral Clearance Using Disposable Systems in Monoclonal Antibody Commercial Downstream Processing. Biotechnol. Bioeng. 100:488-496.
18.) Zhou, JX, and T. Tressel. 2006. Basic Concepts in Q Membrane Chromatography for Large-Scale Antibody Production. Biotechnol. Progr. 22:341-349.
19.) Zhou, JX. 2006. New Q Membrane Scale-Down Model for Process-Scale Antibody Purification. J. Chromatogr. A 1134:66-73.
20.) Zhou, JX. 2008. Implementation of Advanced Technologies in Commercial Monoclonal Antibody Production. Biotechnol. J. 3:1185-1200.
You May Also Like


