Development of a Stand-Alone Monitoring Application for Purification Processes in BiomanufacturingDevelopment of a Stand-Alone Monitoring Application for Purification Processes in Biomanufacturing
The ability to monitor unit operations in biomanufacturing is essential because it enables early fault detection and effective root-cause analysis. Below, we present a case study on the development of a stand-alone, data-driven, process-monitoring application for a biomanufacturing purification process. We review the application’s functionality and highlight its utility using a few examples from commercial manufacturing of a therapeutic protein. Lessons learned from the development of that application also are presented. The progress and performance of a purification process have been monitored through trends in UV absorbance (for determining protein content), conductivity (for determining buffer salt content), and pressure (for determining the presence of blockage in a system).
Purification Process and Data
In a purification process, a recombinant therapeutic protein synthesized during a cell-culture process is isolated and purified from the pool of other proteins that are simultaneously produced by mammalian host cells. The type of recombinant protein determines the kind of chromatographic columns to be used in the purification process. Examples include ion-exchange, hydrophobic-interaction, and affinity chromatographies (1). A purification process is segregated into phases, including equilibration, loading, washing, elution, and finally regeneration and storage of a purification column. Each step uses specific buffers at predetermined conductivities to facilitate purification. Low-salt buffers (low conductivity) enable proteins to bind to stationary phase of a purification column, and high-salt buffers (high conductivity) detach bound protein molecules and make them flow out of a column.
During equilibration, a purification column’s internal pH and conductivity are equilibrated with a low-conductivity buffer before a protein solution is loaded. After a column is loaded with a target protein solution (in an equilibration buffer), those protein molecules bind to the stationary phase, and impurities flow through the column into waste. During the wash step, a wash buffer at a slightly higher conductivity is passed through the column to dislodge loosely bound impurities while attached target protein molecules are kept intact. During elution, a high-conductivity buffer is passed through the column to dislodge target protein for further purification or fill–finish (Figure 1).
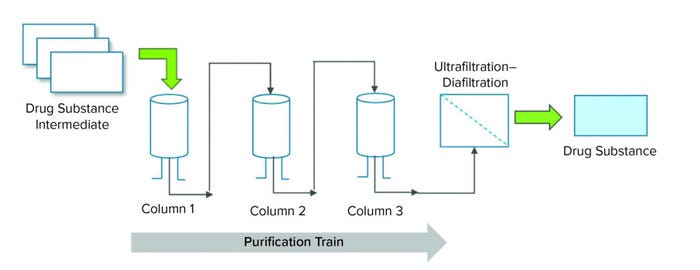
Figure 1: Overview of a purification process for a therapeutic protein.
Data and Data Sources: Data provided the foundation for developing our application. We used data from in-line measurements of different parameters, including totalized volume of flow-through column conductivity, UV absorbance, pressure, and flow rate.
The PI process historian (OSIsoft) provided data from process measurements. The software system stored process data during process execution and made them available for evaluation. It consists of two elements: the PI archive and PI asset framework (PI AF) components. The PI archive component stores time-series data (e.g., raw data from sensors detecting the above parameters). Because preparative chromatography is a batch process, additional context is needed to extract appropriate data from the historian. For that reason, the PI AF stores batch metadata such as phase information and start–end timestamps so that in conjunction with time-series, the batch progression can be recreated. Those data are made available using a representational state transfer (REST) application programming interface (API), which allows data retrieval using standard internet technology. We used MATLAB 2015b software (The Mathworks) for data processing, analysis, and visualization.
Results and Discussion
Business Needs and User Requirements: During purification of a therapeutic protein, signals are generated through in-line sensors mounted to a chromatography skid. Those data are stored in a process historian. Manufacturing scientists and production experts need to be able to quantitatively assess the latest purification batch in the context of historical data. Typically, generating a report requires multiple manual operations. Data acquisition, preprocessing on ad-hoc basis, and report generation (including visualization) are labor intensive and time consuming.
We designed and developed a stand-alone purification-process monitoring graphical user interface (GUI) application to enable end users to
• automate data acquisition and reporting to increase efficiency
• enable automated quantitative data preprocessing and visualization to increase effectiveness of process-monitoring activities.
Process-Monitoring Application: We developed the application in MATLAB software and compiled it into a stand-alone GUI application executable file that can be run on end users’ computers. End users input the date ranges for batches that they want to visualize. For multiple purification columns, users can select the column name for which they want to retrieve information.
Figure 3 shows how the application automatically performs the following tasks. It connects to PI historian by means of a REST API to obtain data (historical data and data from a recently produced batch). Figure 2 shows this process in two steps. The application queries the PI AF database to obtain the start and end timestamps for each phase of a selected purification column. Next, the start and end timestamps are used to query the PI archive, segment the continuous time-series data of interest (e.g., column output conductivity), and download them to the application. The application then performs predefined signal processing operations such as data alignment and offsetting and makes predefined calculations (explained below). It generates overlays of continuous chromatography column signals and control charts with descriptive statistics based on continuous signals. The application saves data analysis outcomes into Excel files in a user-defined folder. Finally, it generates a report by exporting figures automatically into a PowerPoint file and saving that file into a user-defined directory.
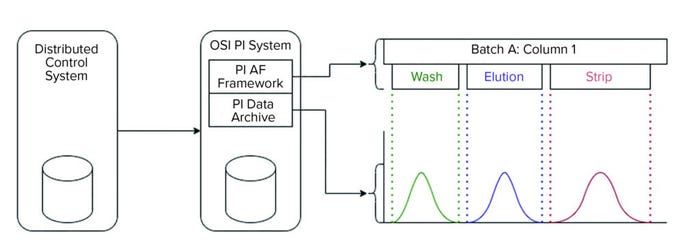
Figure 2: Purification data acquisition overview; data from chromatography column skids are captured by a distributed control system and stored in the PI process historian. The continuous time-series signals are stored in the PI archive, whereas the batch context (e.g., phases consisting of unit operation and start–end timestamps) are stored in the asset framework (AF) database. The process monitoring application first obtains the start and end timestamps for a specified phase from AF to query and segments the continuous time-series data stored in the PI archive.
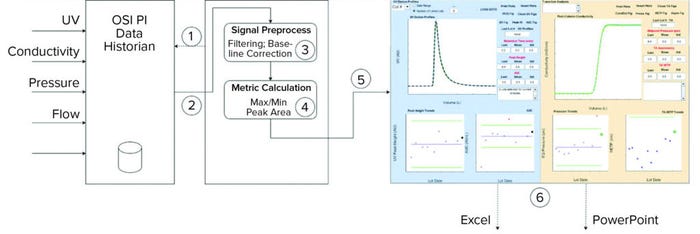
Figure 3: Overview of process monitoring graphic user interface (GUI) application functionality; the application performs the following steps: 1 connects to a data historian, 2 downloads data of interest (batch info and time-series data), 3 performs signal processing, 4 runs calculations, 5 generates overlays and control charts, and 6 outputs results to Excel and PowerPoint applications.
Data Visualization and Reporting: The GUI process-monitoring application shown in Figure 4 comprises two panels. The left panel is used to analyze UV signals and generate features (e.g., descriptive statistics) from continuous time-series chromatography data. The right panel is used to analyze conductivity data and generates additional features such as height equivalent to a theoretical plate (HETP) and equilibration pressure point (described below). End users define and initiate data query by selecting a purification column and predefined phase (e.g., elution) of interest from a drop-down menu. Alternatively, end users can define the number of batches for analysis. A progress bar pops up to indicate data acquisition of batch context, and continuous time series takes place sequentially (Figure 5). Once data acquisition is completed, results show up in corresponding plots (Figure 6). The UV signal (Figure 6a) from the elution phase for the most recent batch appears as a black dashed line overlaid on historical data and plotted against the total volume of buffer flowing through a column.
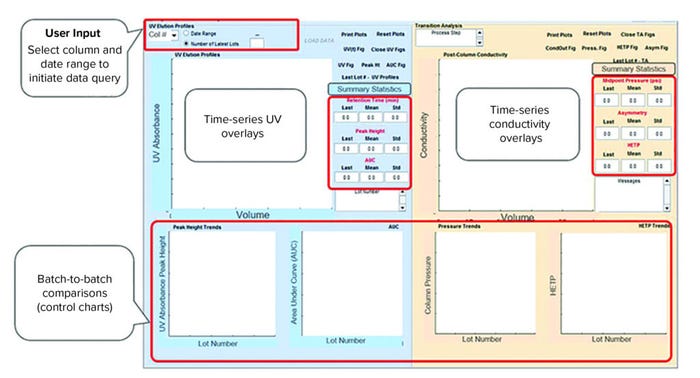
Figure 4: Overview of a graphical user interface (GUI) for a chromatography process monitoring application; the left panel is used for UV signal analysis, and the right panel is used for analysis of conductivity signals.
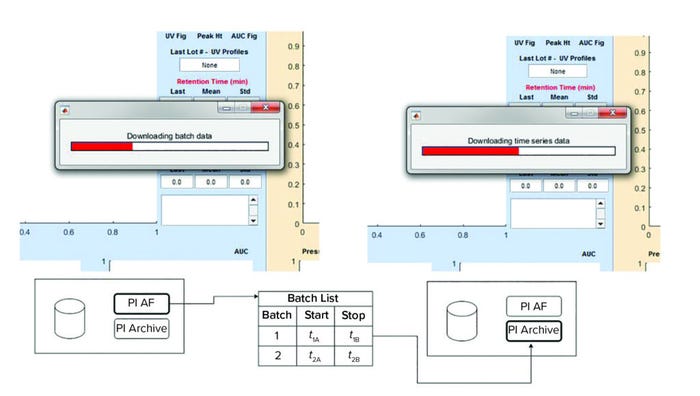
Figure 5: Data acquisition for process monitoring application; (left) initially the batch data queried, and (right) subsequently, the time-series signals are obtained.
Corresponding UV peak and area under the curve (AUC) values are represented as black solid circles, and historical batches are shown as blue “x” marks (Figure 6c). Green lines represent control limits based on data for the time period requested on the application. All batches that have values outside of those control limits appear as red dots and can be investigated for root cause analysis.
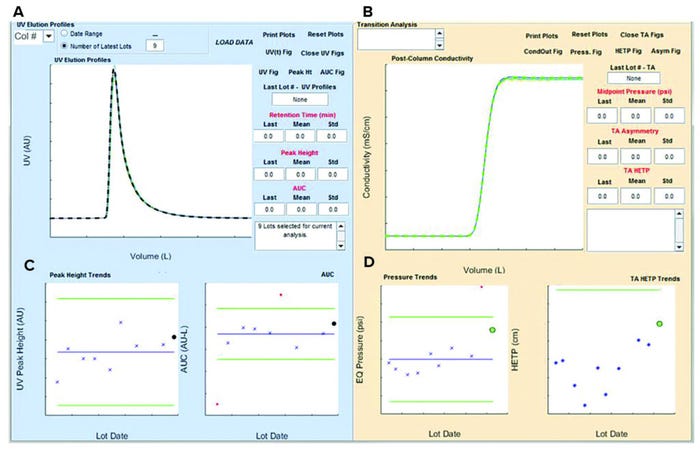
Figure 6: Example of chromatography graphic user interface (GUI) application report upon completion of data acquisition and analysis.
Overlay of elution-phase conductivity profiles with the most recent batch in green (Figure 6b) and trends of equilibration-phase pressure and HETP values (Figure 6d) are plotted. A batch with a value that is outside the control limits (shown as green lines in Figure 6d) is depicted with a red dot, and the most recent batch is shown in a green circle.
Summary Statistics and Metrics of Column Performance: AUC and HETP are metrics for the analysis. AUC is defined as the area under the postprocess UV and totalized volume curve. HETP is a metric defined for assessing purification column efficiency or integrity (how well a column resin bed is packed). HETP is calculated from the conductivity signal data (Figure 9, left). For that calculation, the following is used: HETP = L/N = Lσ2 (M02/M12), in which Mk = ∫V1V2 (dc/dV) dV is the kth moment of (dc/dV) distribution; dc/dV is calculated as the first derivative of conductivity C with respect to totalized volume V; and σ2 = M2/M0 – (M1/M0)2 is the variance described in terms of distribution’s moments (2).
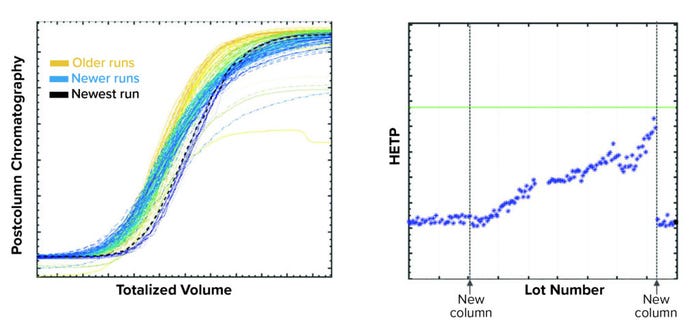
Figure 9: Example of a subtle trend detected using the purification-monitoring application; (left) shallowing of conductivity profiles is observed; and (right) height equivalent to a theoretical plate (HETP) values show an upward trend. Column repacking returns HETP values to baseline level.
Use Cases
The usefulness of the process monitoring application for detecting patterns and trends is illustrated in three cases. The first case (Figure 7) refers to an excursion that was detected by means of the conductivity signal overlay. The excursion also manifested itself as an HETP value outside the control limits. The ensuing investigation determined that air entrainment in the chromatography column was the root cause for this excursion.
The second case (Figure 8) relates to a downward mean shift in AUC value. That shift was attributed by process experts to a change in the column loading levels.
The third use case (Figure 9) pertains to a subtle trend detection by observing shallowing of the conductivity profile. That change also was captured effectively in the control chart as HETP values trended upward. The HETP value returned to baseline level after a column was repacked.
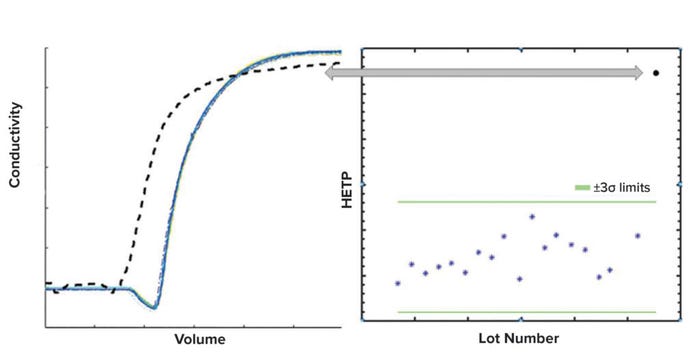
Figure 7: Excursion detection using a purification-monitoring application; (left) a typical conductivity profile is shown as a black dashed line in the conductivity overlay plot. The height equivalent to a theoretical plate (HETP) for this conductivity profile is outside of +3σ limits (right). Air entrainment was determined as the root cause for the excursion.
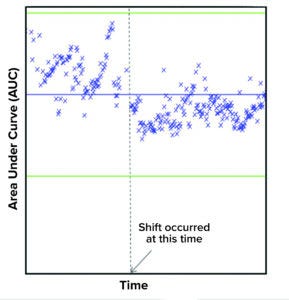
Figure 8: Example of shift detection using purification monitoring application shows a downward mean shift in the area under curve (AUC) value. Dotted line denotes the approximate time when the shift occurred. Change in the loading levels to the column was the root cause for this shift.
Benefits
The development and deployment of the stand-alone chromatography process monitoring application offers key benefits to process experts. The application substantially increases the efficiency of generating regular reports by analyzing the most recent purification runs against historical data. The application can analyze data and generate a report in 5–15 minutes, depending on the number of historical data evaluated. By contrast, a process expert can take a week to acquire data manually, preprocess data, and compile a report. Thus, the application helps biomanufacturers streamline process-monitoring tasks. It also enables process experts to focus on making sense of data patterns and trends and to come up with data-driven insights and recommendations.
The application increases effectiveness of process-monitoring efforts. It enables near–real-time evaluation of recently completed purification runs. Without that capability, personnel need to wait for quality control (QC) laboratory results for in-process controls (e.g., column yield), which typically are lagging indicators of column performance. Excursion detection is rendered more effective by evaluating the most recent batch in the context of historical expectation provided by historical data. Descriptive statistics and column metrics such as HETP provide additional tools for detecting subtle changes in column performance.
Lessons Learned
Designing, developing, and deploying a stand-alone process-monitoring GUI application offered the opportunity to share the following lessons learned:
• Information technology infrastructure (e.g., a process data historian) and direct programmatic access are two prerequisites for providing end users with automated real and near–real-time analytics applications
• Development of the application is historian agnostic because all programming languages that support efficient application development could be used (e.g., MATLAB, Python, and R applications)
• Batch metadata are necessary to enable time-series signal segmentation
• Availability of historical data is necessary for application testing.
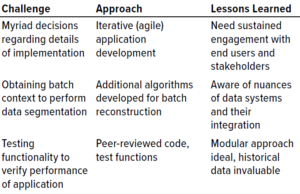
Table 1: Challenges, solutions, and lessons during development of a chromatography process monitoring graphic user interface (GUI) application.
Table 1 lists some specific challenges faced during the development of this application and the approach taken to address them.
Improved Process Monitoring and Analysis
Process monitoring is key in biomanufacturing because it provides process scientists and manufacturing experts with the ability to detect trends and patterns in near-real time and support root-cause analysis. Process monitoring also enables the quantification of process variations so that scientists can understand further their bioprocess operations and make improvements.
The case studies and results that we present herein demonstrate how we developed and implemented a stand-alone GUI application for monitoring chromatography columns used in the purification of a therapeutic protein. The application enables automatic processing of in-line data from a process historian and generates quantitative metrics that facilitate the comparison of a purification batch in the context of historical data. We showed how the application could detect trends and excursions to increase the effectiveness of process monitoring and troubleshooting efforts. Finally, the automated data acquisition, analysis, and processing reduced the time and effort required for generating reports from about a week to about 10 minutes.
Acknowledgments
The authors acknowledge the support from Manufacturing Sciences and Technology and Production colleagues with the development and testing of this process-monitoring application.
References
1 Pathange LP, Huang L, Tsang J. Development and Application of a Simple and One-Point Multiparameter Technique: Monitoring Commercial-Scale Chromatography Process Performance. BioProcess Int. 16(11–12) 2018: 40– 49; https://bioprocessintl.com/downstream-processing/chromatography/monitoring-commercial-scale-chromatographic-process-performance.
2 Larson TM, et al. Use of Process Data to Assess Chromatographic Performance in Production-Scale Protein Purification Columns. Biotechnol Prog. 19(2) 2003: 485–492; https://doi.org/10.1021/bp025639g.
Further Reading
Mleczko M, Maiti S, Spetsieris K. Establishing a Digital Platform for Data Science Applications in Biopharmaceutical Manufacturing. BioProcess Int. 20(1–2) 2022: 34–39; https://bioprocessintl.com/2022/january-february-2022/establishing-a-digital-platform-for-data-science-applications-in-biopharmaceutical-manufacturing.
Spetsieris K, et al. Pathogen Safety Digital Platform for Biopharmaceuticals: The Journey from Ground to Cloud. BioProcess Int. 19(11–12) 2021: i12–i17; https://bioprocessintl.com/2021/november-december-2021-featured-report/pathogen-safety-digital-twin-case-study-for-biopharmaceuticals.
Maiti S, Mleczko M, Spetsieris K. Multivariate Data-Driven Modeling for Continued Process Verification. BioProcess Int. 19(10) 2021: 40–44, 50; https://bioprocessintl.com/manufacturing/process-monitoring-and-controls/mvda-models-for-continued-process-verification.
Maiti S, Spetsieris K. Data-Driven Modeling for Biopharmaceutical Purification Processes. BioProcess Int. 19(9) 2021: 44–51; https://bioprocessintl.com/manufacturing/process-monitoring-and-controls/advanced-data-driven-mvda-modeling-for-biopharmaceutical-purification-processes.
Corresponding author Konstantinos Spetsieris is head of data science and statistics, Michal Mleczko is biotech digitalization lead, Shreya Maiti is in staff development, and Shyam Panjwani is senior data scientist, all at Bayer US LLC, 800 Dwight Way, Berkeley, CA 94710; 1-510-705-4783; [email protected]; http://www.bayer.com.
You May Also Like
