Evaluation of a New Single-Use UV Sensor for Protein A CaptureEvaluation of a New Single-Use UV Sensor for Protein A Capture
As the adoption of single-use systems continues to expand beyond bags and tubing to complete process steps, a full range of sensing technologies will be needed to complement the resulting varied single-use applications. Single-use sensors must meet or exceed the performance of traditional sensing technologies in areas such as accuracy, response time, ease of use, control system integration, process compatibility, regulatory requirements, and cost. Single-use flow-through process sensors are currently available for pressure, temperature, flow, and conductivity. Here, we report results from a comparative study of a new single-use flow-through UV absorbance sensor against traditional UV detection equipment in a protein A capture chromatography application.
Elements of UV Detection
Several types of chromatography steps are routinely used to separate components during downstream processing in biopharmaceutical manufacture. Protein A affinity chromatography with UV spectroscopic detection is one of the most important types, partly because of its strong affinity for antibodies.
PRODUCT FOCUS: ANTIBODIES
PROCESS FOCUS: DOWNSTREAM
WHO SHOULD READ: ANALYSTS, PROCESS MANAGERS
KEYWORDS: PURIFICATION, DISPOSABLES, DATA ACQUISITION, IN-LINE MONITORING
LEVEL: INTRODUCTION
UV detection is particularly useful in bioprocess applications because biomolecules can absorb specific wavelengths of light between 200 and 400 nm. In particular, proteins usually show strong absorbance around 280 nm because of the presence of aromatic amino acids in their structures. According to the well-known Beer’s Law, the amount of light absorbed is directly proportional to the concentration of an absorbing molecule in the path length of the light. The path length through which the light travels is also important. For long path lengths, more of a light-absorbing molecule is present in the light’s path. A detector measures the ratio of incoming (incident) light energy to the energy that has passed through a sample as a measure of the absorbance of a material. A simple UV chromatogram compares time withabsorbance in a flow-through system as molecules in a solvent move through a UV light beam.
Table 1: Comparison of system design specifications
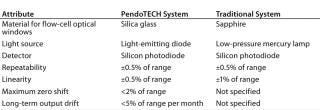
Table 1: Comparison of system design specifications ()
In-line monitoring of UV absorbance during bioprocess chromatography is commonly applied for
determination of when to start and end collection of a product-related peak
confirmation of proper process execution during batch record review (by comparing a chromatogram with a reference chromatogram)
identification and characterization of potential process disturbances during process investigations
batch-to-batch process trending.
Often, accuracy at low-absorbance values (<0.5 OD) is most critical because peak collection start and end points typically occur at low-absorbance values. In certain applications, however, accuracy at higher absorbance values may be of interest such as when comparing peak heights or areas corresponding to impurity-related and product-related peaks for process trending. A UV system must have proper specifications to ensure that the instrument will have both the required sensitivity and range for a particular application.
A New UV Sensor
PendoTECH has developed a single-use, flow-through UV sensor with a path length of 1 cm and hose barb connections to attach tubing to a process stream (Photo 1). Reusable couplers for focusing UV light are screwed into the sensor. Attached to the couplers are fiber-optic cables that in turn are attached to a compact light source/detector photometer. The photometer is built with an LED light source of a customer-specified single wavelength from 240 to 1,000 nm. The photometer is powered by 24V from a wall supply and has a tare button to blank-out solvent background absorbance. The photometer also functions as a transmitter with a 4–20 mA analog signal scaled to 0–2 AU (absorbance units).
Photo 1:
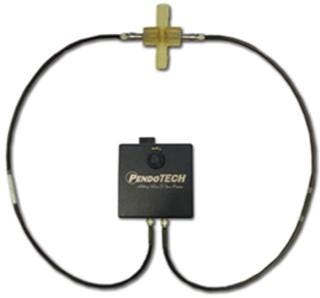
Photo 1: ()
The single-use flow cell is made from USP Class VI, polysulfone free of animal-derived components. The cell windows through which UV light passes into a process stream are high-purity fused silica glass. The flow cell can be sanitized with dilute NaOH and can be gamma irradiated.
Comparative Studies
We placed the PendoTECH sensor/photometer/transmitter equipped with a 280-nm light source slightly upstream of a traditional UV-absorbance detector with a stainless-steel flow cell for a direct comparative trial of both approaches (Figure 1). PendoTECH system’s compact design is evident with the single-use flow cell connected (using tubing with hose barbs) to the process. The process application used for the evaluation was protein A chromatography for capture of protein from clarified mammalian cell culture fluids.
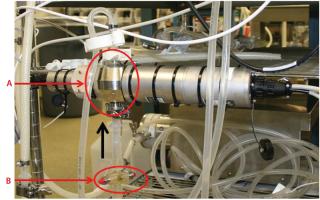
Figure 1: ()
From both detector systems, transmitter outputs of 4–20 mA were connected to a National Instruments 9207 A/D converter for capture and recording of data on a PC using LabView software (National Instruments). The optical path length for the comparator traditional flow cell is 0.5 cm. To normalize absorbance results from the different detector path lengths, we converted absorbance into optical density (on a 1-cm path length basis) by using the following equation: Optical density = (instrument absorbance units, AU) ÷ (instrument optical path length, cm). Figures 2 and 3 provide example process chromatograms comparing results obtained from both monitoring systems.
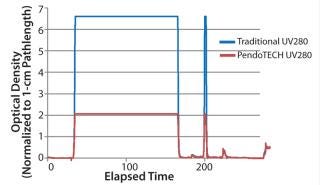
Figure 2: ()
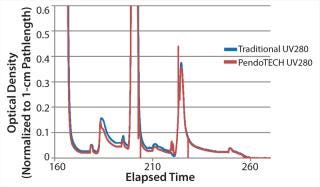
Figure 3: ()
The traditional UV absorbance measurement system has a maximum scale of 3 AU (OD = 6). The PendoTECH UV system maximum scale is 2 AU (OD = 2). Hence, the OD for the PendoTECH instrument is observed to go off scale in Figure 2 at a lower OD value than the traditional sensor.
Results: A Comparative Monitoring System
Aside from the different maximum-scale OD values, the process chromatograms are comparable (Figures 2 and 3). At low-absorbance values, the data from either monitor are quite similar (Figure 3), with only minor differences that may be attributable to small offsets in calibration and data acquisition signal conditioning. Peak collection in this process is based on UV absorbance value. The points for start and end of eluate peak collection are essentially the same for both monitor systems. For this application, the PendoTECH UV monitoring system provides a suitable single-use flow cell alternative to traditional equipment that are accompanied by fixed-asset stainless steel flow cells.
About the Author
Author Details
Paul Renaut is a scientist III in downstream process development at Amplimmune, Inc., 45 West Watkins Mill Rd., Gaithersburg, MD 20878. Corresponding author Dennis Annarelli, PhD is the technical manager at Pendotech, 66 Witherspoon Street Suite 256, Princeton N J 08540; 1-609-799-2299; [email protected].
REFERENCES
1.) Furey, J, K Clark, and C Card. 2011. Adoption of Single-Use Sensors for BioProcess Operations. BioProcess Int. 9:S36-S42.
2.) Schmid, F-X 2001.Biological Macromolecules: UV-Visible SpectrophotometryEncyclopedia of Life Sciences, Macmillan Publishers, New York.
3.) Scott, C 2012. Ten Years of Chromatography. BioProcess Int. 10:S32-S36.
You May Also Like


