Optimization, Robustness, and Scale-Up of MAb PurificationOptimization, Robustness, and Scale-Up of MAb Purification
The biopharmaceutical industry needs faster and more efficient development of new drugs and their market introduction as well as shorter process development times for both upstream and downstream operations. It has become more commonplace to use high-throughput development techniques to save time (1). Development is also sped up by applying platform technologies based on the unsurpassed selectivity of protein A resins (2,3,4,5,6), which is the foundation for downstream processing of monoclonal antibodies (MAbs).
This is the second of two articles describing development of a downstream process for a MAb product, from screening in 96-well plates to scale-up using two separate formats. The first article covered rapid microplate development in BioProcess International a year ago (7).
We developed a highly efficient two step chromatography process by applying high-throughput process development (HTPD) techniques using PreDictor plates for screening (7) followed by optimization in small-column format using a design of experiment (DoE) approach (Figure 1). Here we describe the optimization and robustness study as well as scale-up. For the two chromatography steps, we combined DoE and a Monte Carlo simulation.
PRODUCT FOCUS: MONOCLONAL ANTIBODIES
PROCESS FOCUS: DOWNSTREAM PROCESSING
WHO SHOULD READ: PROCESS DEVELOPMENT, PROJECT MANAGERS, AND MANUFACTURING
KEYWORDS: CHROMATOGRAPHY, POLISHING, OPTIMIZATION, ROBUSTNESS, DoE, MONTE CARLO SIMULATION, SCALE-UP
LEVEL: INTERMEDIATE
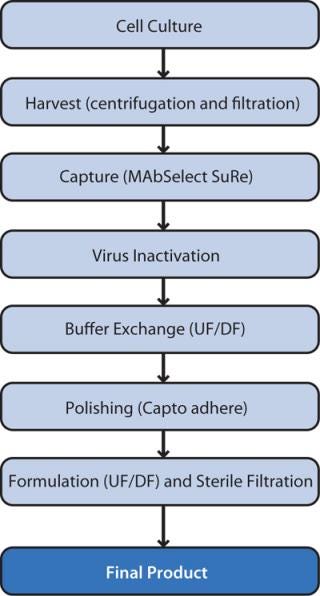
Figure 1: ()
We used two different approaches for scale-up: The first was a ready-to-use process with ReadyToProcess single-use products, and the second involved a traditional (stainless steel) process (Figure 2). The traditional format is the obvious choice for large-scale manufacturing, whereas the ReadyToProcess approach is ideal for pilotscale, clinical production, and small-scale production applications (8, 9). We evaluated the whole purification process, not just the chromatography steps. The main purification challenge for this process was a high and varying number of dimer/ aggregates (D/A) in material coming from the cell culture. These levels varied roughly between 10% and 15%.
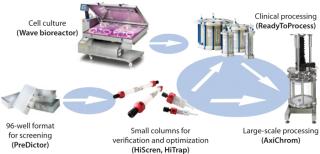
Figure 2: ()
Materials and Methods
The IgG MAb was expressed in Chinese hamster ovary (CHO) cells at 1.2 g/L. Our sample was clarified cell culture supernatant. Screening (chromatography resins, flow through, binding and elution conditions) and optimization using PreDictor plates have been described previously (7). Our optimization and robustness studies, for both capture and polishing steps, used HiScreen columns as described below.
For scale-up, we cultured cells in a traditional stainless-steel 120-L bioreactor with 100-L working volume or in a WAVE Bioreactor system 200 with a working volume of 100 L. The traditional process was harvested by centrifugation (4,000g for 20 minutes) followed by filtration through ULTA Prime GF (0.6 µm) and ULTA Pure HC (0.6/0.2 µm) capsules. For the ReadyToProcess route, we applied harvest flocculation (8) followed by centrifugation and filtration through an ULTA Pure HC (0.6/0.2 µm) capsule. We stored filtrate in sterile containers until the protein A capture step. To control bioburden and product stability, we filtered product pools through an ULTA Pure HC sterilizing-grade filter after every unit operation.
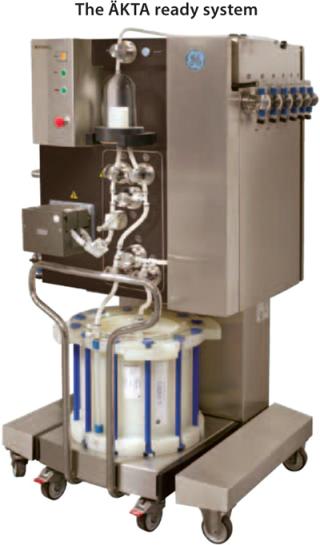
To scale up the ReadyToProcess purification, we used an ÄKTA ready system with a disposable flow path (low-flow kit). ReadyToProcess 1-L columns were used for both the capture step (using MabSelect SuRe) and polishing on the Capto adhere multimodal resin (10). For the traditional approach, we used AxiChrom 70/30 columns packed to a 20.5-cm bed height with MabSelect SuRe and to 14.1 cm for Capto adhere. The capture step load was 31 g/L, and the polishing step load was 60 g/L. Directly afterward, we performed a virus inactivation treatment for 40 min at pH 3.8.
Between the virus inactivation and the polishing step, buffer exchange by crossflow filtration for the traditional process used three Kvick lab 30-kDa NMWCO ultrafiltration/diafiltration (UF/DF) cassettes (total membrane area 0.33 m2) and a Uniflux 10 crossflow filtration system. The ReadyToProcess route used a 60-cm hollow-fiber UF/DF filter with 30-kD NMWCO (0.48 m2). Our filtration system was a fully disposable setup based on ReadyCircuit subassemblies connected with ReadyMate disposable aseptic connectors. To change the buffer, we used six diafiltration volumes of equilibration buffer for the polishing step. For both scale-up routes, the final formulation step used the same type of equipment as the buffer-exchange step. We performed an 18-fold concentration with a buffer exchange using six volumes of formulation buffer at a sixfold concentration factor. To recover a maximum amount of product, we rinsed with the formulation buffer and pooled with the product fraction to give a final concentration factor of 10.FACTORS STUDIED
Factors Studied
We measured IgG concentration using analytical protein A chromatography with a 1-mL HiTrap MabSelect SuRe column. Monomer purity was assessed by size exclusion chromatography (SEC) using two Superdex 200 5/150 GL columns connected in series to achieve optimal peak separation. We measured HCP levels using commercial anti-CHO HCP antibodies from Cygnus Technologies. Essentially, we adapted an ELISA methodology to a Gyrolab Workstation LIF from Gyros AB
using Gyrolab Bioaffy 200 microlaboratory discs. We measured ligand leakage with a commercial ELISA kit from Repligen Corp (part number 9333-1) using a slightly modified protocol. Optimization and Robustness Studies
We performed an optimization and robustness study for both chromatography steps, but only the study for the capture step is reported here. We applied HiScreen columns (bed height 10 cm; volume 4.7 mL) using an ÄKTAexplorer 100 system for both studies. The same approach was followed for the polishing step: optimization and robustness studies using small prepacked columns filled with Capto adhere resin. For the HTPD screening part of process development for the polishing step, see our previous article (7).
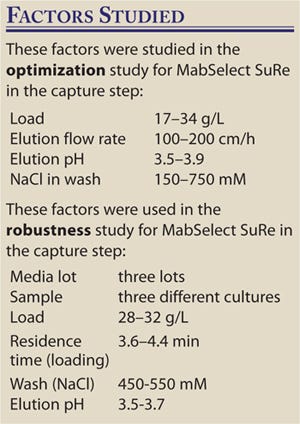
For optimization we used a DoE approach, applying MODDE software from Umetrics and using HiScreen columns. The “Factors” box shows factors and ranges we studied. Robustness study responses were yield, HCP clearance, ligand leakage, and D/A removal. Figure 3 shows a “sweet spot” analysis of the MabSelect SuRe step, a plot based on predetermined criteria for purity and yield. Our goal in optimizing the capture step was primarily to maximize yield, and the optimization study showed that yield was indeed the most important response (7). As a result, it was the prioritized response in our subsequent robustness study, although we also included HCP clearance, ligand leakage, and D/A removal.
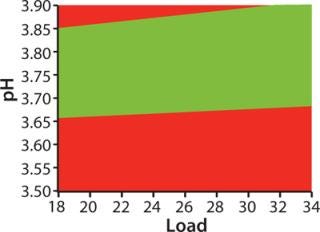
Figure 3: ()
The “Factors” box shows the factors and ranges we used in our robustness study. Yields varied between 94.8% and 100%. The results show that the we method developed consistently fulfills the predetermined criteria for purity and yield (Figure 3), so we deemed that method to be robust.
Data obtained from the DoE optimization study were transferred to Crystal Ball software from Oracle Corp. for Monte Carlo simulations. We ran a total of 10,000 iterations and assessed the probability of values for yield and purity falling within certain predefined parameters. Again we judged monomer yield to be the most important factor, designing the Monte Carlo simulation to look at that with these initial factor settings: load 24–27.5 g/L, NaCl concentration in the intermediate wash step 430–470 mM, elution flow rate 140– 160 cm/h, and elution pH 3.6–3.8. Figure 4 (TOP) shows the results. We predicted a yield of 92.4–95.6%. By increasing the load range to 25.7–30.0 g/L and decreasing the pH range to 3.5–3.7, we increased that yield to 94.7–96.0% as determined in a subsequent simulation (Figure 4, BOTTOM). The range also narrowed, indicating more robust conditions for the step.
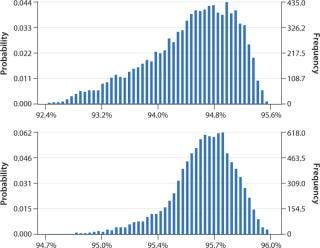
Figure 4: ()
We developed both crossflow filtration processes by screening pressure drop and transmembrane pressure to give maximum flux without membrane fouling. For the formulation step, we determined a concentration factor at which diafiltration should be performed to obtain the fastest process by time optimization (concentration factor on the x axis at the maximum value when plotting flux concentration factor against it). Scale-Up
We successfully transferred a two-step chromatography process to pilot scale using both traditional and ReadyToProcess methods. Our scale-up results were very similar for both formats (Table 1). Figure 5 overlays three cycles from the capture step on the AxiChrom column, and Figure 6 shows a chromatogram obtained for the polishing step using Capto adhere resin (also run on the AxiChrom column). Chromatography profiles for those two steps run on ReadyToProcess columns (data not shown) are indistinguishable from those obtained the traditional way, except for differences stemming from the slight difference in column sizes.
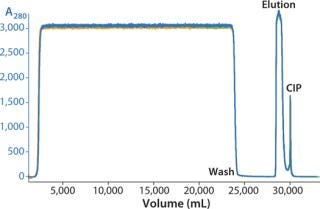
Figure 5: ()
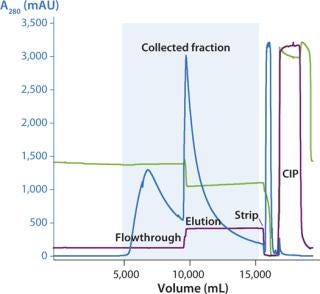
Figure 6: ()
Table 1: Summary of monomer yield, D/A content, HCP reduction, and ligand leakage in the two scale-up approaches (RTP=ReadyToProcess approach, AxiChrom=traditional process)

Table 1: Summary of monomer yield, D/A content, HCP reduction, and ligand leakage in the two scale-up approaches (RTP=ReadyToProcess approach, AxiChrom=traditional process) ()
This process was seamless, from screening in the HTPD format (7) through the optimization and robustness studies to scale-up. Despite the challenging material (high D/A content), we developed an efficient purification process using only two chromatography steps. The two-step process required one buffer-exchange step between capture and polishing but was still highly competitive compared with a traditional three-step process. Results from both traditional and ReadyToProcess scaled-up processes were very similar in terms of overall yield as well as purity of the MAb product obtained.
The ReadyMate product is covered by US patent #6,679,529 B2, owned by Johnson & Boley Holdings, LLC and licensed to GE Healthcare companies. GE, “imagination at work,” and the GE monogram are trademarks of General Electric Company. ÄKTA, ÄKTApilot, AxiChrom, Capto, HiScr
een, HiTrap, MabSelect SuRe, Kvick, PreDictor, ReadyCircuit, ReadyMate, ReadyToProcess, Superdex, ULTA, Uniflux, and WAVE Bioreactor are trademarks of GE Healthcare companies.
About the Author
Author Details
Annika Forss is a senior research engineer, Gustav Rodrigo is a senior scientist, Jakob Liderfelt is a scientist, Karin Torstensson is a senior research engineer, and corresponding author Kjell Eriksson is a senior scientist in Life Sciences R&D, GE Healthcare Bio-Sciences AB, Björkgatan 30, SE-751 84 Uppsala, Sweden; 46-18-6120539, [email protected]; www.gelifesciences.com.
REFERENCES
1.) Bergander, T. 2008. High-Throughput Process Development: Determination of Dynamic Binding Capacity Using Microtiter Filter Plates Filled with Chromatography Resin. Biotechnol. Prog. 24:632-639.
2.) Slaff, G. 2005.. Application of Technology Platforms to the Purification of Monoclonal Antibodies.
3.) Sofer, G, and LC Chirica. 2006. Improving Productivity in Downstream Processing. BioPharm Int. 19:48-53.
4.) Shukla, AA. 2007. Downstream Processing of Monoclonal Antibodies: Application of Platform Approaches. J. Chromatogr B 848:28-39.
5.) Ishihara, T, and T. Kadoya. 2007. Accelerated Purification Process Development of Monoclonal Antibodies for Shortening Time to Clinic: Design and Case Study of Chromatography Processes. J. Chromatogr B 1176:149-156.
6.) Low, D. 2007. Future of Antibody Purification. J. Chromatogr B 848:48-63.
7.) Engstrand, C. 2010. Rapid and Scalable Microplate Development of a Two-Step Purification Process. BioProcess Int. 8:58-66.
8.) Liderfelt, J Eibl, R. and D.. 2010.A Comparison of Performance and Process Time Between Traditional and Ready-to-Use Disposable SystemsThe Manufacture of MAbs, John Wiley and Sons, Hoboken:335-342.
9.) 2008. Guide to Disposables. BioPharm Int. supplement.
10.) Eriksson, K. 2009. MAb Contaminant Removal with a Multimodal Anion Exchanger: A Platform Step to Follow Protein A. BioProcess Int. 7:52-56.
You May Also Like


