Using Automated Immunoassays for HCP Analysis in Early Bioprocess DevelopmentUsing Automated Immunoassays for HCP Analysis in Early Bioprocess Development

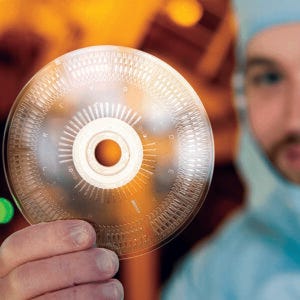
Photo 1: Microfluidic device as an option for automated high-throughput HCP analytics in early bioprocess development (HTTPS://WWW.GYROSPROTEINTECHNOLOGIES.COM/ IMMUNOASSAYS/GYROLAB-TECHNOLOGY)
Biopharmaceutical drugs are produced by a number of expression host systems, mainly mammalian (e.g., Chinese hamster ovary, CHO) and microbial (e.g., Escherichia coli) cells. The goal of subsequent purification steps is production of a pure drug substance, which is essentially free of product variants and process-related impurities such as host cell proteins (HCPs) and nucleic acids. Depending on the process, HCPs can represent the total proteome of a host cell line and accordingly are highly diverse in size, charge, hydrophobicity, and function (e.g., enzymatic reactions).
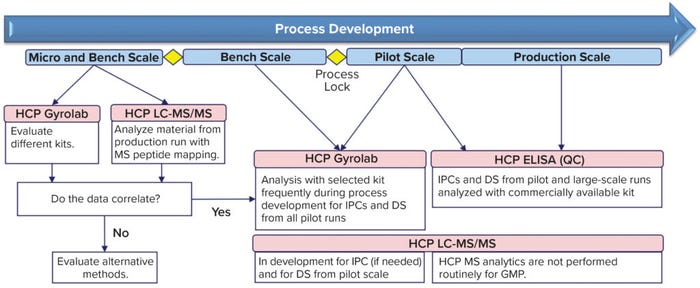
Immunogenic HCPs can pose a potential risk for patients. Moreover, many HCPs can present a danger to a biotherapeutic product by facilitating its degradation or modification of the drug substance itself or its formulation (1). Therefore, HCP analysis during early process development is recommended to help biopharmaceutical companies understand and overcome HCP-related difficulties in bioprocessing. That is especially true for the diverse microbially expressed molecule formats made at Boehringer Ingelheim, which are produced through individualized procedures. Such distinct processes present challenges but also become valuable sources of knowledge. Here, we briefly introduce our HCP monitoring concept, which has proven to be successful during early process development for microbially derived products (Figure 1).

Figure 1: Host cell protein (HCP) analysis in early process development at Boehringer Ingelheim’s regional center in Vienna, Austria — from micro to production scale; not shown is that in late process and commercial phases a product-specific host cell protein (HCP) enzyme-linked immunosorbent assay (ELISA) will be used. DS = drug substance, IPC = in-process control, GMP = good manufacturing practice, LC-MS/MS = liquid chromatography with tandem mass spectrometry, and QC = quality control.
Bioprocess development starts at a miniaturized scale, generating a large number of samples for high-throughput (HT) screening — e.g., resin screening for purification. Nowadays, such screenings are indispensable in helping process engineers find the optimal parameters for their processes in a reasonable time (2). Hence, companies need analytical methods with sufficient throughput to support such development efforts. We have found the Gyrolab system — running miniaturized, automated immunoassays on a compact disc (CD) type of platform (Photo 1) — to be most suitable for that purpose (3).

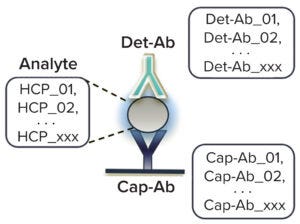
Figure 2: GyroLab host cell protein (HCP) polyclonal immunoassays detect the highly diverse pool of different HCPs from host cells that are present in process samples such as culture supernatant and process intermediates. The capture antibody (Cap- Ab) is immobilized by biotinylation on a streptavidin matrix, and the detection antibody (Det-Ab) is fluorescence labeled with Alexa Fluor 647 dye.
Immunoassay Automation
Gyrolab systems analyze HCPs through a sandwich immunoassay principle (Figure 2), using a capture antibody labeled by biotinylation and a detection antibody with an Alexa Fluor 647 fluorophore (Thermo Fisher Scientific). So far, we have been able to adapt all of our enzyme-linked immunosorbent assay (ELISA)–based HCP assays to run on the Gyrolab high-throughput platform as HT HCP assays.
During initial process development (Figure 1), we test relevant process step pools with at least two different E. coli HT-HCP assays and compare the results with those from corresponding HCP peptide mapping by liquid chromatography with tandem mass spectrometry (LC-MS/MS). Then, the assay that correlates best with those LC-MS/MS results is used further to gain a robust understanding of the process.
Our primary goal in each case is to find an assay that elucidates the same trend as LC-MS/MS analysis shows; absolute content values are a secondary concern. Nevertheless, high HCP values remain a key parameter for process optimization. After a bioprocess is locked in, the company’s quality control unit (QC) supports process-development analytics using the HCP ELISA that is used for release testing later on. Routine establishment of HCP ELISAs for QC includes learnings from the HT-HCP assay. Additional commercial assays are tested to identify the generic kit that best fits the process that will be validated further. Ultimately, HCP analysis is performed at production scale using the respective ELISAs. If necessary, we might also apply LC-MS/MS for supporting characterization, but it is not used for routine monitoring.
The HT-HCP assay format is used optimally in the early phase of bioprocess development. It requires only small sample volumes (<10 µL), and for 96 single samples, just <50 µL of antibody solutions are needed (100 µg/mL), with a total immunoassay time of about 1.5 hours. Those parameters compensate for the associated buffer and CD investments. The assay time includes all steps that are relevant to immunoassays except for sample preparation, which is performed separately before the HCP analysis.
Sample Preparation: We prepare our samples using a liquid handling system (LHS) to reduce manual labor and for better reproducibility, robustness, and user independence. Additionally, we prepare the HCP reference standard curve using the same LHS. From previous work, we have learned that the Gyrolab Rexxip sample dilution buffer stabilizes protein analytes so well — both HCPs and proteins of interest (PoIs) — that it protects them from freezing and thawing, with no stability effects at –60 °C and below. Therefore, we prepare a standard reference curve in a 2-mL volume for each concentration point, aliquot the standard in 20-µL volumes, and store those at–60 °C or below. Thus, in addition to saving time and materials, the reference curve is maintained independently, agnostic of both users and equipment (e.g., pipettes), so it can be reproduced any time.
An important feature of the Gyrolab system is its flow-through function at the capture resin within CDs for analyte binding. That mode minimizes the contact time between antibodies and their targets and thus reduces matrix effects by comparison with plate-based ELISAs (4). Such effects are especially important for HCP assays, in which the ratio of matrix to assay buffer can be high in bioprocess samples.
System Suitability: For tracking the performance of HCP assays, we highly recommend including at least one system suitability testing (SST) sample within all sample sets. Different strategies for SST have been developed (5). We use a commercially available HCP reference standard diluted to a suitable concentration (about 5 µg/mL) in Gyrolab Rexxip dilution buffer and store the resulting samples in aliquots (100 µL) at ≤–60 °C. Those samples are treated like all HCP samples and go through the whole automated process (sample preparation, analysis, and evaluation). We routinely apply the same SST to different HCP assays from different vendors, which further facilitates their application.
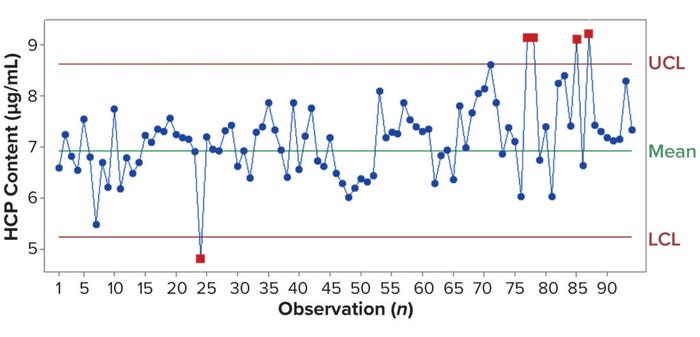
Figure 3 is a control-chart example for an HCP assay. Westgard et al. described the use of SST and control charts in 1981 (5). We apply the three-sigma (3σ) rule to identify outliers — content below the lower control limit (LCL) or above the upper control limit (UCL) — which would indicate issues in the workflow. For example, the outliers of observations 75 and later in Figure 3 originated from a carryover problem with the LHS. That problem was solved by switching the tip equipment on the system. In another case, a dilution buffer contamination was identified through the SST (data not shown). Further, SST can be helpful in bridging experiments for new reagent batches (e.g., labeling of the immunoassay antibodies) (6). The information obtained from control charts can be invaluable in both troubleshooting and further discussions, especially for process development and long-term use. And not to be underestimated is the confidence that it gives users in their analyses and in the performance of automated techniques.

Figure 3: A high-throughput HCP (HT-HCP) assay control chart for system suitability tests between 2021 and 2023; every observation reflects an HCP assay. The mean content is calculated from observations 1–40 and defined by the three-sigma (3σ) rule as lower and upper control limits (LCL, UCL). Outliers are marked by red squares.
An Orthogonal Approach
The primary goal of HCP analysis is to generate reliable information about HCP depletion throughout a downstream process. Note that no currently available method is truly quantitative (7). For example, labor-intensive MS methods sensitively identify individual HCPs and quantify their abundance. At the same time, reported HCP contents depend highly on sample preparation (e.g., protein digestion), ionization efficiency, sample separation by liquid chromatography, and evaluation of the resulting data. The upcoming USP chapter <1132.1> will address those concerns (8).
On the other hand, an automated, miniaturized, and HT HCP immunoassay combines all those individual HCPs into one cumulative HCP content value. The drawback is that highly abundant single HCPs can be missed because specific antibodies might not be present in sufficient quantities. Therefore, whenever possible, orthogonal HCP detection methods should be applied on selected representative samples (Figure 1) to enhance process understanding.
Figure 4 compares LC-MS/MS and HT HCP assay results for samples originating from a single production run (a) and for an overall comparison of drug substances from eight different production runs of the same product (b). The latter processes all were executed within one year. Overall the comparability is satisfactory, allowing for reasonable application of both methods. We use LC-MS/MS as an orthogonal method to support application of the less labor-intensive immunoassay, and the added knowledge it provides also helps with possible troubleshooting. For example, if issues arise with product or buffer degradation caused by trace amounts of respective disintegrating HCP enzymes, LC-MS/MS would make those apparent.

Figure 4: HCP method comparison of LC-MS/MS and GyroLab analysis; for LC-MS/MS data, 18C-column separation was combined with an Orbitrap Astral mass analyzer (Thermo Fisher Scientific) in data-dependent acquisition (DDA) mode. Panel (a) compares samples from one production run; panel (b) is a linear correlation (R² = 0.73) of different production runs for one drug substance and process. UF/DF = ultrafiltration/diafiltration.
Process Scale-Up: With the transition from pilot to production scale, HCP ELISAs replace the HT HCP assay (Figure 1). In directly comparing the same samples using the same HCP reagents, we saw 2–3× over- and underestimation between these methods as a general observation (Table 1). No correlation arose among the products, however, presumably because our microbially derived processes are so diverse. We work with genetic strain backgrounds and many different biopharmaceutical formats such as protein scaffolds, enzymes, antibody fragments, and peptides. Just as the differences between LC-MS/MS and Gyrolab results are not problematic in process development, these discrepancies between ELISA and Gyrolab results also are not problematic as long as the same trends can be seen. In our experience, we typically see the same trends in results from both assay formats. Irregularities are sample-specific for certain process steps, such as the lower matrix effects of the HT HCP assay mentioned above (4).

Table 1: Comparing HCP results for five different products from Gyrolab and traditional enzyme-linked immunosorbent assay (ELISA) analyses.
Taken together, the introduced structured concept for HCP monitoring enables development of an optimal process from the early development phase on. Within this workflow, combining LC-MS/MS and Gyrolab results provides an essential method for reliably handling the constantly increasing sample numbers and demanding project timelines of biopharmaceutical development.
References
1 Jones M, et al. “High-Risk” Host Cell Proteins (HCPs): A Multi-Company Collaborative View. Biotechnol. Bioeng. 118 (8) 2021: 2870–2885; https://doi.org/10.1002/bit.27808.
2 Walther C, et al. Smart Process Development: Application of Machine-Learning and Integrated Process Modeling for Inclusion Body Purification Processes. Biotechnol. Prog. 38(3) 2022: e3249; https://doi.org/10.1002/btpr.3249.
3 Increasing Productivity in Biopharma R&D. Gyros Protein Technologies AB: Uppsala, Sweden, 2023; https://www.gyrosproteintechnologies.com/immunoassays.
4 Solutions to Immunoassay Interference, Cross Reactivity and Other Challenges. Gyrolab SpinBlog 19 February 2020; http://www.gyrosproteintechnologies.com/spinblog/immunoassay-interference-crossreactivity-challenges.
5 Westgard JO, et al. A Multi-Rule Shewhart Chart for Quality Control in Clinical Chemistry. Clin. Chem. 27(3) 1981: 493–501; https://www.aefa.es/wp-content/uploads/2014/04/A-Multi-Rule-Shewhart-Chart-for-Quality-Control-in-Clinical-Chemistry.pdf.
6 Ritter N, et al. Bridging Analytical Methods for Release and Stability Testing: Technical, Quality and Regulatory Considerations. BioProcess Int. 14(2) 2016: 12–23; https://bioprocessintl.com/analytical/product-characterization/bridging-analytical-methods-for-release-and-stability-testing-technical-quality-and-regulatory-considerations.
7 Zimmermann E, et al. High-Throughput Methods Evaluation Impurities Determination During Upstream and Downstream In-Process Development. BioProcess Int. 14(2) 2016; 24–32; https://bioprocessintl.com/upstream-processing/assays/high-throughput-immunoassay-platform-impurities-determination.
8 Host Cell Protein Contaminants in MAb Manufacturing. US Pharmacopeial Convention: Rockville, MD, 2023; https://www.usp.org/biologics/mabs/host-cell-protein-contaminants-in-mab-manufacturing.
Corresponding author Martin Voigtmann is a senior scientist in analytical development, and Alexandra Foettinger-Vacha is the former director of analytical development (now a lecturer at the Higher Federal Teaching and Research Institute for Chemistry, Industrie Rosensteingasse) at Boehringer Ingelheim RCV GmbH & Co KG, Doktor-Boehringer-Gasse 5-11, 1120 Wien, Austria; 43-1-80105-9770; [email protected]; https://www.boehringer-ingelheim.com. Gyrolab, Bioaffy, and Rexxip are registered trademarks of Gyros Protein Technologies AB. Orbitrap and Alexa Fluor are trademarks of Thermo Fisher Scientific.
You May Also Like


