- Sponsored Content
An Effective Orthogonal Method for Host Cell Protein AnalyticsAn Effective Orthogonal Method for Host Cell Protein Analytics
Sponsored by Cygnus Technologies
Host cell proteins (HCPs) can copurify with a biological drug substance (DS), posing potential risks for both patients and drug manufacturers. Although many HCPs are benign, some are immunogenic, others can interact with a DS and diminish its efficacy, and others can interfere with DS stability. Thus, the quantity and nature of residual HCPs in a DS generally are considered to be critical quality attributes (CQAs) that constitute a significant part of a drug developer’s overall risk-management strategy (1–5).
HCP identification and quantification by mass spectrometry (MS) is a powerful complementary method for demonstrating the suitability of an HCP enzyme-linked immunosorbent assay (ELISA). Herein, we present examples of how our company’s Antibody Affinity Extraction (AAE) technique followed by MS can be used to demonstrate an HCP ELISA suitability. We also show how the AAE-MS method can be used to identify HCPs in DS samples.
Antibody Coverage Analysis
AAE immunoaffinity chromatography is designed to assess coverage of a polyclonal antibody (pAb) for an array of process-related HCPs and to determine pAb reactivity to process-specific HCPs that could copurify with a DS. Cygnus Technologies developed the method in 2013 to overcome deficiencies with traditional orthogonal methods for assessing HCP coverage — e.g., two-dimensional (2D) Western blots and 2D differential-in-blot electrophoresis. Subsequently, the AAE coverage-assessment method was included in United States Pharmacopeia Chapter <1132> on measurement of residual HCPs in biologics (6).
To perform the AAE method, an anti-HCP pAb is immobilized covalently onto a chromatography support. The column is conditioned to prevent significant antibody leaching and minimize nonspecific binding. A sample with undenatured HCPs is passed over the column for binding. The column is washed to remove HCPs that remain on the column unbound or due to nonspecific protein–protein interactions. Then, immunoreactive HCPs are eluted with acid. This cycle is repeated four times. HCP elution fractions are pooled, buffers are exchanged, and the material is concentrated back to the original sample volume.
Post-AAE material representing immunoreactive HCPs can be analyzed by MS. Alternatively, post-AAE samples can be separated by 2D polyacrylamide gel electrophoresis (PAGE) and analyzed either by comparison to a silver stained pre-AAE sample or by 2D difference gel electrophoresis of starting and extracted samples labeled with cyanine 3 or 5 (Cy3, Cy5). Coverage is assessed by comparing the number of HCPs in the post-AAE elution fractions (as determined by MS or by staining with silver or Cy3) with those identified by MS or 2D PAGE in the starting sample (using silver or Cy5 staining) (Figure 1).

Figure 1: Antibody coverage analysis by the Antibody Affinity Extraction (AAE) method, with options for 2D PAGE or LC-MS; MW = molecular weight, pI = isoelectric point.

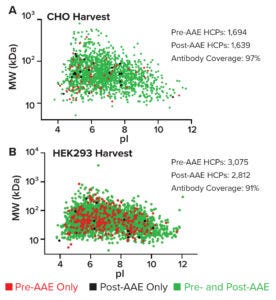
Figure 2: Virtual 2D gels plotting HCPs in pre- and post-AAE samples from (A) a CHO cell-culture harvest and (B) a HEK293 null-cell lysate; MW = molecular weight, pI = isoelectric point.
LC-MS and Virtual 2D Gel Graphs
For analysis by liquid chromatography–mass spectrometry (LC-MS), pre- and post-AAE samples are precipitated, dissolved, reduced, alkylated, digested with trypsin, desalted, and concentrated. Data are acquired using a Vanquish ultrahigh-performance liquid chromatography instrument and an Orbitrap Eclipse Tribrid mass spectrometer (Thermo Fisher Scientific). HCPs are identified by two peptides per protein based on results from triplicate runs, and data are analyzed using a curated Chinese hamster ovary (CHO) HCP database (Cygnus Technologies) and Proteome Discoverer software (Thermo Fisher). Virtual 2D gel graphs are generated in Prism 9 software (GraphPad). Therein, green spots represent immunoreactive proteins found in both pre- and post-AAE samples. Red spots denote nonimmunoreactive proteins in the pre-AAE sample. Black spots show immunoreactive proteins found only in the post-AAE sample. As Figure 2a shows, pAbs from the Cygnus Technologies F550-1 CHO-HCP ELISA 3G kit cover 97% of HCPs found in CHO cell-culture harvests. Antibodies from the resupply F650S HEK293 HCP ELISA 3G kit cover 91% of HCPs found in HEK 293 null-cell lysate (Figure 2B).
AAE-MS Identification of HCPs in a DS
Although regulatory agencies traditionally have requested coverage of the total HCP mixture present in a cell-culture harvest stream, HCPs that could persist in a DS beyond purification remain the most important consideration. Identification and quantification of such HCPs by MS is a powerful complementary method to ELISA; however, drug products often mask HCPs by a factor of 10⁴–10⁶.

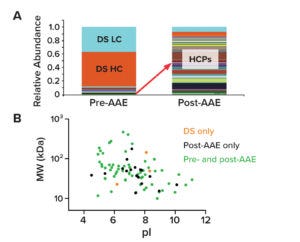
Figure 3: The AAE-MS method enriches host-cell proteins (HCPs) and depletes drug substance (DS) from samples. (A) shows the relative abundance of peptides from HCPs and DS heavy and light chains (HC, LC) in pre- and post-AAE samples. (B) provides MW and pI data on a virtual 2D gel of pre- and post-AAE peptides.
The AAE method effectively enriches HCPs and depletes DS. Figure 3a shows normalized stacked-bar charts with the relative abundance of product proteins and HCPs according to their extracted ion chromatograms. The left bar presents proteins identified in a pre-AAE DS sample. DS heavy and light chains (HC, LC) are marked in orange and light blue, respectively. HCPs are shown in assorted colors. As Figure 3A indicates, most material in the pre-AAE sample belongs to product proteins. Following AAE enrichment (right bar), however, the relative abundance of HCPs dramatically increases while DS HC and DS LC levels decrease.
MS can provide predictive molecular weight (MW) and isoelectric point (pI) values for HCPs identified in a DS sample. Such data can be graphed on a virtual 2D gel to help downstream groups develop purification strategies (Figure 3B). By focusing on a “potentially problematic HCP” in a quadrant of the virtual gel, teams can leverage column chemistries to eliminate HCPs of interest.
The Increasing Importance of MS for HCP Analytics
MS is important to HCP analytics, from investigational new drug (IND) application submission through postmarketing activities, when drug developers evaluate impacts from process changes, perform risk assessments, and characterize reagent changes. Although complete characterization of downstream HCPs is not part of current regulations, proactive biomanufacturers and regulators recognize the value of such information for ensuring patient safety and drug efficacy.
References
1 Jones M, et al. “High-Risk” Host Cell Proteins (HCPs): A Multi-Company Collaborative View. Biotechnol. Bioeng. 118(8) 2021: 2870–2885.
2 Wang F, et al. Host-Cell Protein Risk Management and Control During Bioprocess Development: A Consolidated Biotech Industry Review, Part 1. BioProcess Int. 16(5) 2018: 18–25.
3 Wang F, et al. Host-Cell Protein Risk Management and Control During Bioprocess Development: A Consolidated Biotech Industry Review, Part 2. BioProcess Int. 16(6) 2018: 42–47, 64.
4 Vanderlaan M, et al. Experience with Host Cell Protein Impurities in Biopharmaceuticadls. Biotechnol. Prog. 4(4) 2018: 828–837.
5 Karengera E, et al. Altering the Central Carbon Metabolism of HEK293 Cells: Impact on Recombinant Glycoprotein Quality. J. Biotechnol. 242, 20 January 2017: 73–82.
6 USP 39–NF 34 <1132>. Residual Host Cell Protein Measurement in Biopharmaceuticals. United States Pharmacopeia: Rockville, MD, 2016.
Corresponding author Alla Zilberman is vice president of technical marketing ([email protected]), Jared Isaac is associate director of chromatography and mass spectrometry, and Eric Bishop is vice president of research and development, all at Cygnus Technologies, LLC (part of Maravai LifeSciences); https://www.cygnustechnologies.com.
You May Also Like


