- Sponsored Content
- PAT
- Process Development
- Validation
Bioprocess Development and Qualification: PAT-Based Stage 1 and 2 Acceleration StrategiesBioprocess Development and Qualification: PAT-Based Stage 1 and 2 Acceleration Strategies
Sponsored by 4Tune Engineering

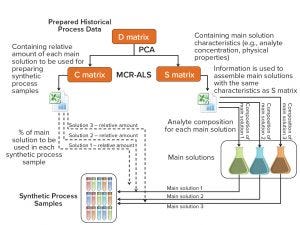
Figure 1: Method and system for preparing synthetic multicomponent biotechnological samples according to established scale-independent multiattribute monitoring calibrations; PCA = principal component analysis, MCR-ALS = multivariate curve resolution–alternating least squares (1)
Well-established process analytical technology (PAT) strategies, such as those based on spectroscopy, bring with them several challenges related to the nature of those tools themselves (1–3). Such tools are multiparametric by design — in the sense that most spectroscopies capture multiple attributes sometimes different in nature (e.g., near-infrared, NIR, captures chemical and physical attributes simultaneously). Often a reference method is required; at other times, indirect calibrations are based on the correlation of one culture attribute with another for which a chosen PAT tool lacks adequate selectivity or sensitivity. Finally, building monitoring calibrations during process development is extremely difficult when conditions are intentionally challenged and only minimal nominal batches are available. Such conditions can defeat the whole purpose of using PAT-based monitoring intensification strategies to support development and accelerate process understanding.
Process samples are commonly used for development of multivariate calibrations even though such samples consist of complex matrices in which process dynamics and sampling frequency often do not match. The use of orthogonal design of experiments (DoE) can help overcome such drawbacks, although it usually yields comparably poor calibration results for spectroscopy sensors, has only three to five levels of variation, and can be used only for measurable variations.
Considering all the limitations of using process data and performing enough DoE on cell-based systems, here we present a method for preparing synthetic cell-free multicomponent samples that mimic their cell-based dynamic processes. The method greatly enhances speed, accuracy, and robustness of calibration models, thus establishing the grounds for PAT-based stages 1 and 2 acceleration strategies for bioprocess development and qualification (at scale or down scale).
For illustration, we use as reference a fed-batch cultivation of Chinese hamster ovary (CHO) cells. The following analytes’ profiles from a typical fed-batch fermentation were measured by off-line standard analytical methods: viable cell density, glutamine, glutamate, glucose, lactate, ammonia, product, and asparagine.
As Figure 1 shows, this methodology starts with evaluation and organization of historical process data across process time (data matrix D). Data are preprocessed using autoscaling, and a principal component analysis (PCA) is performed to estimate the number of main solutions needed to mimic the process. In this case, the PCA model shows that three main solutions can be used to prepare the synthetic samples. With the assumption that only binary mixtures can be used to describe the complete fermentation (two principal components), the model still cannot explain 20% of the variance. It is then advisable to split the process into smaller fractions by reanalyzing matrix D using PCA, adjusting the principal components to two, and starting with just three samples in each data subset. For each data subset, if the explained variance is higher than 95%, then another sample is added, and the procedure stops when the captured variance falls below 95%.
After establishing the number of main solutions for each part of the fermentation, we run the multivariate curve resolution–alternating least squares (MCR-ALS) algorithm by setting an initial multicomponent analyte composition and relative amount for each main solution. In this case, the initial content of main solution A1 is 1 whereas for B1 it is 0. We use MCR-ALS to extract the main solutions’ composition and mixture profile. Evaluation of the algorithm’s estimations showed that the model’s results were very similar to the off-line data used to generate the main solutions and their fractions.
The second part of the study consists of increasing the number of synthetic multicomponent samples for better capture of process dynamics and to overcome the typical low number of samples available compared with the variability of a specific analyte attribute and a specific accuracy. Creation of samples between a specific interval can guarantee better capture of the transition and a uniform number of samples with variation. By representing the relative amount against time, it is possible to obtain an nth-order polynomial to estimate the amount of this solution for a specific time and thus increase the number of samples.
Because this is a binary system, the amount of solution B1 can be calculated as a difference from 1 and the relative amount of A1 solution. This process was extended to the other data subsets, and we tested the method experimentally by assembling the solutions. We used MCR-ALS results and the increased data points obtained in this step to create the synthetic samples that mimic the process.
We saw that some highly correlated analytes might lead to calibrations with lack of selectivity that could underperform if new batches presented different profiles. Preparation of such samples included programmed spiking to break colinearities by concentrated analyte solutions. To create data samples to improve calibration models, we minimized unknown or undesired correlations that could not be measured by analytical methods (such as changes affecting spectra but not the analyte amount). To do so, we planned an additional dataset based on mixing random amounts of two or more arbitrary process samples.

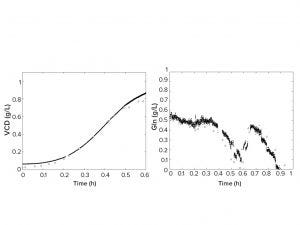
Figure 2: Predicted viable cell density (left) and glutamine concentration (right) across fermentation time. Black circles represent on-line predictions of a fermentation run and the white diamonds represent off-line reference analytics; VCD = viable cell density,
Gln = glutamine.
The last step of the approach was to create NIR and midinfrared (MIR) spectroscopy calibrations using samples generated in the previous steps. Spectra and analytical properties of all samples were obtained to develop calibrations using multivariate data analysis methods such as projection into latent structures (PLS) regression. Thus, it was possible to predict viable cell density and glucose in real fermentation runs. Figure 2 shows the successful use of synthetic multivariate and programmed spiking samples to develop calibrations for online monitoring of real fermentation runs.
This approach creates real, complex samples that mimic process trends and from which spectra are acquired. This is advantageous because it allows for development of evenly distributed and robust calibrations.
The proposed method overcomes problems related to process dynamics and sampling frequency, allows for creation of a high number of samples, reduces the high amount of offline analytics needed, and shortens the time required to develop calibrations in complex systems. It therefore has all the required capabilities to accelerate process understanding accumulation (stage 1) and form the basis of a new approach to building scale-independent monitoring models and calibrations. For that reason, the method could support scale-up/-down activities. With such a strategy, the multivariate culture parameters and quality attribute space (a process design-space) at two scales can be replicated faster and ensure better consistency (e.g., in product quality attributes). Finally, being able to check and replicate the cells’ physical chemistry environment accurately before and after a change will lead to improved process transfers (stage 2) and faster creation of more realistic scale-down qualified process models.
References
1 Menezes JC, Buziol S, Felizardo P. Method and System for Preparing Synthetic Multi-Component Biotechnological and Chemical Process Samples. Hoffmann–La Roche AG (2015); WO/2015/097217.
2 Buziol S, et al. Combination of Spectroscopic Methods for Inline Monitoring and Control of Mammalian Cell Cultivations. IFPAC-2013, 22–25 January 2013, Baltimore, MD.
3 Henriques JG, et al. Monitoring Mammalian Cell Cultivations for Monoclonal Antibody Production Using Near-Infrared Spectroscopy. In Optical Sensor Systems in Biotechnology. Advances in Biochemical Engineering/Biotechnology, Vol. 116, Rao G. (Ed.). Springer: Berlin, Heidelberg, 2009.
Stefan Buziol, PhD, is a principal scientist for pharmaceutical technical development biologics Europe USP, at Roche Diagnostics GmbH. José C. Menezes, PhD, is founder and CEO of 4Tune Engineering Ltd (www.4TuneEngineering.com). Sofia T. Santos, MSc, is a senior bioengineering expert on MS&T for biopharmaceutical operations at 4Tune Engineering ([email protected]).
You May Also Like


