- Sponsored Content
Evolution and Uptake of Bioprocess Economic ModellingEvolution and Uptake of Bioprocess Economic Modelling
 The commercial successes of the biopharmaceutical industry over the past 20 years are a reflection of a maturing industry whose increasing focus on efficiency and cost effectiveness will expand the adoption of digital technologies into knowledge management, process/cost optimization, and manufacturing. The ultimate goal continues to be reducing costs to manufacture effective medicines efficiently and broaden patient access to life-saving drugs. Here, we review the journey of bioprocess cost models and how they have helped the industry build process knowledge as well as optimize costs and assess manufacturability of product candidates. The latter includes determining fit of a process to a facility along with scalability, economics, and sustainability.
Although concepts of manufacturability and cost of goods (CoG) are discussed and considered widely in the industry today, they were not seen as important from the mid-1980s to the 2000s. A view often expressed in the 1990s was that the pharmaceutical industry was “different, so manufacturing costs do not matter.” That lack of focus on manufacturability and cost was a stark contrast to most other industries (e.g., food, transportation, and chemicals). In its life cycle, the biopharmaceutical industry was shifting from an embryonic to a growth phase, in which it focused initially on understanding the underlying science and developing manufacturing processes with little consideration given to cost.
There were exceptions. In the early 1980s, the first generation of recombinant products had replaced existing naturally sourced products (e.g., insulin). There were good supply chain and quality reasons for that changeover (1). Such products represented an existing high-volume market with a price point that new recombinant alternatives had to meet if their developers wanted to succeed.
That presented a significant manufacturing challenge at the time, when no existing supplier base existed for commercial-scale operations. Replacement hormones kick-started the industry, forcing the move away from the laboratory and into commercial operations with cost-effectiveness in mind. (Editor’s Note: Author Andrew Sinclair was an active participant in scaling up the insulin downstream process and evaluating CoG.)
At that time, development focused on simplifying the manufacturing process. For example, engineering and technology transfers were scaling up the size and number of chromatography columns used to meet capacity requirements: >30 columns, many with diameters >63 cm running at 4 °C. To maximize capacity while minimizing cost, the focus was to maximize column-operation efficiency by optimizing operations and implementing distributed control system (DCS) automation to reduce manual labor. First-generation spreadsheets were used for CoG modeling, with simple models for optimizing chromatography column operations.
The next-generation biological products were more complex molecules that targeted unmet medical needs. Such drugs included interferons, enzyme-replacement therapies, and antibodies. The industry supporting them was in its development phase, still prioritizing basic science over process economics and manufacturability.
Coming of Age: The 2000s
The new century brought rapid growth in the number of approved monoclonal antibody (MAb) products as the industry was shifting into growth and maturation. For antibody products, low bioreactor productivity and relatively high doses used for treatment necessitated significant investments in bioreactor capacity. From 2000 onward came major expansions in world biomanufacturing capacity from 0.4 million liters to 3.4 million liters by 2104 (2). Most bioreactors were stainless steel. One million liters of bulk drug-substance capacity represented a capital cost of about US$7 billion (excluding costs for laboratories, fill and finish, and so on), based on BioSolve Process model results for a standard stainless-steel MAb manufacturing facility housing six 10,000-L bioreactors.
Soon industry experts began to appreciate that capital investments could be high risk, with dangerous vulnerability to product failures and difficulties in forecasting demand. Maintaining an empty facility in an operational state was expensive: A “six-pack,” 10,000-L facility would cost at least $80 million/year. From these circumstances, the industry learned that capital intensity, operating costs (CoG), and risk all needed to be reduced.
That lesson coincided with a longer-term trend of growth in CoG% as a total of sales price. For small molecules in the 1980s, CoG was about 2% of sales price; by 2008, the average CoG for biopharmaceutical products accounted for 14% of their sales price (3). Taking research and development (R&D) as a “sunk cost” leaves manufacturing and sales–marketing (S&M) as the two key variable costs for maintaining profit margins. In the early 2000s, that led to the consideration of many different technologies for reducing capital requirements and overall manufacturing costs.
Detailed assessments of single-use technologies, alternatives to protein A affinity chromatography, and different expression systems (e.g., transgenic plants and animals, microbial alternatives, and others) were pursued to show business value based on process-model outputs.
The industry faced two major challenges in the early 2000s. First, process development and manufacturing for biopharmaceuticals were (and often still are) disjointed activities. Second, no consensus had been reached on how to compare and evaluate process economics of technological improvements. CoG assessments typically were performed internally by company finance groups who calculated a static CoG value late in process development. Such efforts were not geared to examine “what-if” scenarios, which would be required for evaluation of process options and technologies.
Thus, most CoG evaluations were carried out by scientists and engineers using internal spreadsheets. The primary disadvantage was a difficulty in comparing options across the wider industry with a lack of standard definitions and blurred boundaries between what was and was not included. Representative cost data were lacking or contained errors. Each model was built for a specific process, making reuse difficult, and when one model builder left a company, that person’s models often ended up discarded or at least were not maintained.
A Standardized Approach: In the early 2000s, Biopharm Services (BPS) built more than 50 CoG models for biopharmaceutical clients. With that foundation, the company could develop a standard structure and methodology using readily available Microsoft Excel software to enable users to scale their processes. But that initially did not allow users to make process changes. The early goal was to give end users a tool for easily configuring their own processes with the following features:
database of industry-standard resources and costs (with no need to populate large amounts of data)
ease in configuring (with libraries of standard processes and unit operation models)
technology and process neutrality (with a framework that made no assumptions about a given process)
a standardized structure (for use in comparing results within a company and across the industry)
user-friendliness (easy to use and edit)
dependable support (so no model would be dependent on an individual user).
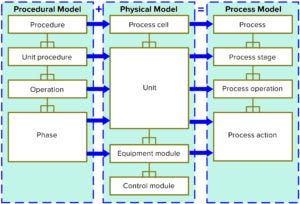
After a number of process-simulation projects, BPS personnel believed that segregating process and facility data into a standardized structure could offer the potential to capture and manage process knowledge digitally. In 2006 BPS began exploring that potential through a collaborative research consortium with Avecia (Fujifilm Diosynth) and Cambridge Antibody Technology (AstraZeneca) to develop a process-knowledge–management model (4). The outcomes of that work included development of a process model based on the International Society of Automation’s (ISA’s) batch control models and terminology (5). Two aspects of the ISA 88 document are especially useful for defining bioprocess models: a separation of process requirements from equipment capabilities and object-oriented hierarchical data (Figure 1). So the consortium developed a prototype database that could be used to manage and implement process recipes. The concept of the process model was patented and published in 2012 (6, 7). Since then, the platform has become an essential prerequisite to digital life-cycle management in the biopharmaceutical industry. The “Modeling Platform” box lists features outlined in the published paper (7).

Figure 1: The International Society for Automation’s ISA 88 data model defines an object-orientated way of describing a process digitally. Translating this into software opens up the opportunities described below
By digitally linking projects that span multiple years and integrating information from an entire product portfolio, companies could link development and manufacturing networks seamlessly (both internally and externally) throughout a product life cycle. This approach maximizes the value of applying machine learning tools.
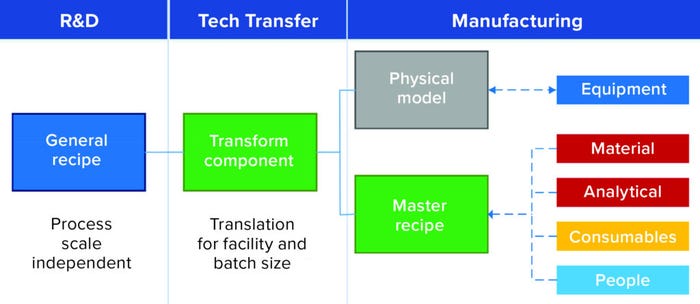
The first commercial software that incorporated those concepts (Figure 2) was BioSolve Process, which was launched in late 2008. The idea behind it was to address industry requirements for a modeling tool that could be configured easily by users to develop CoG models for performing standardized process and technology evaluations consistently across the industry.

Figure 2: BioSolve Process — a real example of applying the ISA 88 data model in a useful predictive application
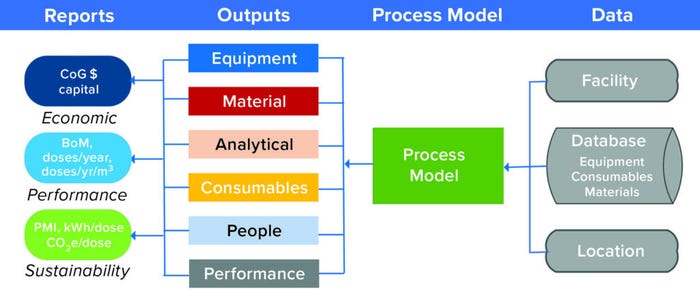
Users wanted to build processes from preconfigured libraries; modify key operating parameters; and then scale out, up, or down to evaluate a range of “what-if” scenarios. Generating a CoG analysis requires carrying out a full mass balance and identifying all key fixed and variable resources to manufacture a product, so BioSolve Process v1.0 (Figure 3) required the process model to
• identify all consumables required for manufacturing
• estimate labor needs
• identify all necessary materials
• define capital equipment requirements and estimate overall capital needs.

Figure 3: BioSolve Process links general data sets and process information to predict the performance of a manufacturing facility, providing insigts into economics, performance, and sustainability; CoG = cost of goods, BoM = bill of materials, PMI = Project Management Institute, CO2e = carbon-dioxide equivalents.
The original launch included batch processes with preconfigured options only for MAbs, vaccines, and microbial products. But it provided a standard approach to CoG that allowed comparisons to be made within and between organizations. Key equipment suppliers recognized the value of the resulting standardized approach, and some had collaborated from the outset by providing prices for standard equipment, components, and materials. Those were averaged out to provide the basis for a cost database that gives users a consistent, commercially relevant resource list to reference when building their own models.
Renewed Product Innovation: The 2010s
In the second decade of this century, the biopharmaceutical industry became interested in technologies that facilitated continuous and intensive processing of MAbs and other proteins enabled by SUTs. Meanwhile, modalities began to shift away from standard MAb platform products with the emergence of multidomain antibodies, antibody–drug conjugates (ADCs), viral vectors, and cell-based therapies. Other important trends during this decade were related to sustainability of biomanufacturing, implementation of process analytical technologies (PATs), movement of fluids and solutions, automation of bioprocessing, the opportunity for real-time release methods, and management of information.
The versatility of the ISA 88 data model underpinning BioSolve Process software was demonstrated by its ability to accommodate all those technology variants without structural changes. New process configurations could be developed (and companies could begin to gain useful insights) in just a few weeks. Over the years, a number of publications have demonstrated the platform’s flexibility — e.g., for next-generation MAb production (8) and the impact of automation strategies on CoG for cell therapies based on chimeric antigen receptor T cells (9). Now the software is used throughout the biopharmaceutical supply chain. Most licensees (55%) are pharmaceutical companies and contract development and manufacturing organizations (CDMOs). Suppliers of equipment and instrumentation hold 33% of BioSolve Process licenses, and the rest are held by engineers, consultants, and academic institutions. Of more than 600 users, 45% are located in the United States, 40% in Europe, and 15% in Asia (mainly Japan).
Whereas the 2000s had identified a need to evaluate process economics rigorously, the 2010s identified a need for additional metrics that could capture the implications of process sustainability and metrics for facility efficiency. Those that link back to sustainability and provide rapid feedback for evaluating process and technology options include
• process mass-intensity ratio of inputs to outputs
• energy efficiency of facilities (can be expressed as kWh/dose)
• operating CO2 equivalence/dose.
The need remains for a single metric that could define operational efficiency overall. A number of measures have been proposed over the years — e.g., bioreactor productivity — but the issue with such metrics is that they tend to focus on just one part of an operation. Improved productivity in one operation can have negative impacts in other aspects of biomanufacturing.
Productivity of cleanroom space — expressed as doses produced per year per unit volume — provides a broader measure of process intensity. Cleanroom operations are a major energy draw, so this metric is related to a building’s overall use of energy and land.
Those additional performance metrics represent extensions to the current process model that serve to enable optimization for strategic business output.
Future Integration: The 2020s and Beyond
As we look to the future, our expectation is that discovery, development, and manufacturing for all biologics will incorporate digital technologies based on Industry 4.0 principles, digital factories, machine learning, and PAT. And we expect BioSolve Process software to integrate with emerging biosimulation tools. That should simplify process development in combination with advanced optimization tools and control strategies, such as added-value digital solutions from Sartorius (10), manufacturing execution systems (MES) from Emerson, and advanced control systems based on machine learning from Applied Materials. The goal is to integrate detailed mechanistic/hybrid models with whole process models in a development and supply-chain context to generate and optimize the economics, efficiencies, and sustainability linking those solutions through the ISA 88 data model to MES, control systems, and laboratory information management systems (LIMS).
A natural progression will be to continue integrating data with MES and electronic batch records (EBR) to automate collection of inputs (e.g., associated with supply chain, raw materials, labor, operation times, and yields) for updating process outputs. We expect to provide a key link with software designed to assist in process development — e.g,. design of experiments (DoE) and mechanistic programs, electronic laboratory notebooks (ELNs), LIMS, and sample management — that enables technology transfer to the most suitable facilities based on an optimized business case and risk strategy.
Those concepts are being explored in a new collaborative project funded by Innovate UK (11). For this project, the BioSolve Process platform is integrating with advanced process control from Applied Materials, which incorporates hybrid modeling to optimize key outputs discussed herein.
Through the development of the BioSolve Process platform, we have demonstrated two things: that translating a process description into a structured data model based on ISA 88 works and that its application has provided real value throughout the supply chain. In 2012, our vision was to translate process descriptions to a structured electronic format that could transform the bioprocessing industry. Seamlessly linking development and manufacturing networks throughout a product life cycle would increase value, maximize yields, and reduce failure risk for users. We hope to achieve that goal over the next decade.
References
1 Quianzon CC, Chiekh I. History of Insulin. J. Commun. Hosp. Intern. Med. Perspect. 2(2) 2012; https://doi.org/10.3402/jchimp.v2i2.18701.
2 Seymour P, Ecker DM. Global Biomanufacturing Trends, Capacity, and Technology Drivers: Industry Biomanufacturing Capacity Overview. Am. Pharm. Rev. 30 June 2017; https://www.americanpharmaceuticalreview.com/Featured-Articles/188840-Global-Biomanufacturing-Trends-Capacity-and-Technology-Drivers-Industry-Biomanufacturing-Capacity-Overview.
3 Basu, et al. Analysis of Manufacturing Costs in Pharmaceutical Companies. J. Pharm. Innov. 3(1) 2008: 30–40; http://dx.doi.org/10.1007/s12247-008-9024-4.
4 Sinclair A, et al. Process Development: Maximizing Process Data from Development to Manufacturing. BioPharm Int. 20(7) 2007; https://www.biopharminternational.com/view/process-development-maximizing-process-data-development-manufacturing.
5 ANSI/ISA-88.00.01-2010. Batch Control Part 1: Models and Terminology. International Society of Automation: Research Triangle Park, NC, 2010.
6 Sinclair PA, Savery JR. Method of Generating Recipe for Process. US Patent No. 8160735, 17 April 2012; https://patents.justia.com/patent/8160735.
7 Sinclair A, Monge M, Brown A. A Framework for Process Knowledge Management: Reducing Risk and Realizing Value from Development to Manufacturing (Part 1, Conceptual Framework) BioProcess Int. 10(11) 2012: 22–29; https://bioprocessintl.com/manufacturing/information-technology/a-framework-for-process-knowledge-management-337778.
8 Pollard D, et al. Standardized Economic Cost Modeling for Next-Generation MAb Production. BioProcess Int. 14(8) 2016: 14–23; https://bioprocessintl.com/business/economics/standardized-economic-cost-modeling-next-generation-mab-production.
9 Lopes A, Noel R, Sinclair A. Cost Analysis of Vein-to-Vein CAR T-Cell Therapy: Automated Manufacturing and Supply Chain. Cell Gene Ther. Ins. 6(3) 2020: 487–510; https://doi.org/10.18609/cgti.2020.058.
10 UK Biomanufacturing Team to Spearhead Development of Advanced Controls to Accelerate Drug and Vaccine Manufacturing. Biopharm Services Ltd.: Bucks, UK, 29 July 2021; https://www.biopharmservices.com/uk-biomanufacturing-team-to-spearhead-development-of-advanced-controls-to-accelerate-drug-and-vaccine-manufacturing.
11 Richelle A, et al. Model-Based Intensification of CHO Cell Cultures: One-Step Strategy from Fed-Batch to Perfusion. bioRxiv 20 May 2022. https://doi.org/10.1101/2022.05.19.492635.
Corresponding author Andrew Sinclair is founder and managing director, Dr. Yuki Abe is director of sales and marketing, and Dr. Rob Noel is head of consulting at Biopharm Services Ltd., Unit 1, Chess Business Park, Moor Road, Chesham,
Bucks, HP5 1SD, United Kingdom; 44-1494-578011; [email protected]; https://www.biopharmservices.com. Dr. David Pollard is head of advanced bioprocessing in corporate research at Sartorius.
You May Also Like


