- Sponsored Content
The Effect of Rocking Rate and Angle on T-Cell Cultures Grown in Xuri™ Cell Expansion SystemsThe Effect of Rocking Rate and Angle on T-Cell Cultures Grown in Xuri™ Cell Expansion Systems
August 10, 2016
Sponsored by GE HealthCare Technologies
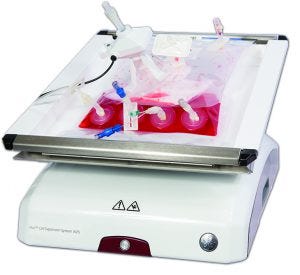 Ensuring optimal and maximal T-cell production is critical for adoptive immunotherapy and its continued success. The Xuri Cell Expansion System is an important component of the clinical manufacturing process. So we sought to investigate the effect of rocking rate and angle on the expansion of T cells. We used a combination of experimental data and predictive modeling and found that the rocking rate significantly influences the expansion potential of T cells with minimal contribution from the rocking angle. The results indicate that a rocking rate of 15 rocks per minute (rpm) and an angle of 6° are optimal for a 1-L bioreactor to maximize cell growth using a Xuri Cell Expansion System.
Introduction
The rapid and reproducible expansion of highly specific T cells from low precursor frequencies to clinically relevant numbers is essential for the success of autologous cell therapy techniques. The Xuri Cell Expansion System uses media perfusion and a rocking platform to achieve cell densities >10 × 106/mL in single-use bioreactors. Achieving high cell densities in a closed environment allows for therapeutic doses to be grown in a single vessel, minimizing the risk of patient-sample contamination and enabling cultures to be grown in smaller volumes, therefore providing a savings of media expense and space requirements. The rocking motion is critical for efficient gas and media mixing and is set by changing the rocking rate and the angle at which the platform tilts. For T cells grown in a 1-L culture volume, our standard rocking conditions have been previously set at 10 rpm with an angle of 6°. We wanted to determine how these parameters individually influence the final cell density so we could determine the optimal settings for maximum cell growth.
Methods
Activation of T Cells in Static Culture: Frozen human peripheral blood mononuclear cells (PBMCs) were thawed, washed twice, and cultured in T225 flasks at 1 × 10⁶ cells/mL in X-VIVO™ 10 media (Lonza) supplemented with 5% heat-inactivated human serum (PAA), 2 mM GlutaMAX™ (Life Technologies), 1% penicillin-streptomycin (Life Technologies), and 20 ng/mL of IL-2 (Peprotech). T-cell expander CD3/CD28 beads (Life Technologies) were added to the culture at a ratio of 3:1 beads:CD3+ T cell. After three days, cells were counted and maintained at 0.5 × 10⁶ cells/mL by media addition for a further two days.

Figure 1: Growth kinetics of T-cell cultures using different rocking rates and angles; cells were grown in static culture for five days before being transferred to the Xuri W5. Error bars representing standard deviation of the mean are shown for 6° rocking angle (n = 3 for 2 rpm, n = 5 for 10 rpm. For all other conditions, n = 1).
Expansion of T cells in Cellbag™ Bioreactors: After five days in static culture, cells were transferred to Cellbag bioreactors and cultured on Xuri Cell Expansion System W5 or W25 for a further nine days. Cells were maintained at 0.5 × 10⁶ cells/mL by adding media to the Cellbag until reaching the final volume of 1,000 mL (usually with 24 h of Cellbag inoculation), after which, perfusion was enabled. Perfusion rates were set to maintain ammonium levels <2.0 mmol/L and lactate levels <25 mmol/L. Rocking rates of 2, 10, and 18 rpm with angles of 2°, 6°, and 9° were used in all combinations, except for 2 rpm and 2°. Cultures were monitored daily for growth and viability (Figure 1).
Analysis: JMP IN™ software (SAS Institute) was used for all statistical and predictive analyses.
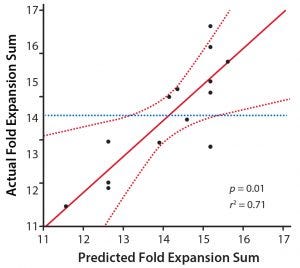
Figure 2: A comparison of model predictions and experimental data for the fold-expansion sum; experimental data points (black dots), transfer function (red line), 95% confidence interval (red dashed line), and mean of fold-expansion sum (blue dashed line) are shown.
Results
At the standard settings of 10 rpm and 6°, T-cell cultures reproducibly reached densities of 15–20 × 106/mL (n = 5). When the rocking rate was lowered to 2 rpm, cell growth was poor, irrespective of the rocking angle used. Conversely, when the highest rocking rate of 18 rpm was used, cell densities above 1 × 10⁷ were achieved at all angle settings (Figure 1). Those data suggest that rocking rate, but not rocking angle, influences T-cell growth.
We then compared cultures with rocking rates of 10 and 18 rpm (Figure 1). The data show that when the rocking angle is set at 2°, a rocking rate of 18 rpm promotes greater cell growth. However, that finding was not replicated when the rocking angle was set at 6° or 9º. When the rocking angle was set at 6°, cell growth was highest with a rocking rate of 10 rpm. And when the angle was set at 9°, cell growth was equivalent for both rocking rates. Thus, from this data set, we could not determine the rocking rate for maximum T-cell growth.
Statistical and Predictive Analysis
To resolve this we applied our experimental data to predictive modeling analysis and established a mathematical relationship between cell growth, rocking rate, and rocking angle. Cell growth was defined as the sum of the 24-h expansion rate from culture days 6 to 14 (fold-expansion sum), and a bivariate least square regression analysis was performed to establish a transfer function linking the fold-expansion sum to the rocking speed and angle. The following linear transfer function was developed: FE = K + β1R + β2A + β3R2 + β4A2 , where FE is the fold-expansion sum, R is the rocking rate, A is the rocking angle, β(1–4) are the coefficients, and K is the constant. The fitting of the coefficients and the statistical analysis were performed using JMP IN software.
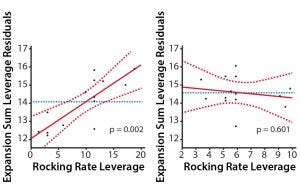
Figure 3: Leverage plots for rocking rate and angle showing a significant contribution of rocking rate to the growth kinetics with minimal contribution from the rocking angle; experimental data points (black dots), transfer function (red line), 95% confidence interval (red dashed line), and mean of fold-expansion sum (blue dashed line) are shown.
Having established a transfer function that fits our experimental data, we analyzed the contribution that rocking rate and angle made to cell growth by generating leverage plots (Figure 3). The pronounced slope of the rocking rate leverage plot shows that the fold-expansion sum is highly dependent on the rocking rate (p = 0.002). Conversely, the slope on the rocking angle leverage plot is almost horizontal and shows that there is no significant relationship between rocking angle and the fold-expansion sum (p = 0.6). Thus, it is rocking rate that dictates the extent to which T cells expand on the Xuri Cell Expansion System.
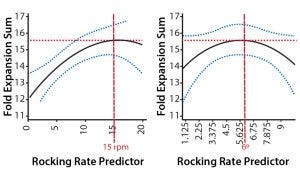
Figure 4: Predictive plots for rocking rate and angle that give maximal T-cell expansion; transfer function (black line), 95% confidence interval (blue dashed line), and point of peak fold-expansion sum (red dashed line) are shown.
We then used the transfer function to predict the optimum rocking rate and angle for maximum T-cell growth (Figure 4). By changing the rocking rate in the transfer function, the maximum fold-expansion is predicted to occur at 15 rpm. Similarly, by changing the rocking angle, the maximum fold-expansion is predicted to occur at 5.7° (6°).
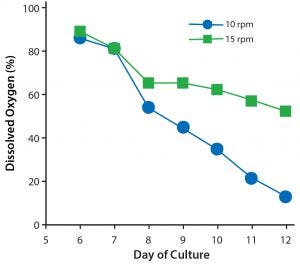
Figure 5: Dissolved oxygen levels in 1 L T-cell cultures rocked at either 10 or 15 rpm.
Effect of Rocking Rate on Dissolved Oxygen
To test what effect increasing the rocking rate to 15 rpm would have on the concentration of dissolved oxygen (DO) in a 1-L culture, two Cellbag bioreactors with integrated optical DO sensors were inoculated from a common static five-day T-cell culture. These were then fitted onto separate Xuri W25 systems. One system was set to rock at 10 rpm and the other at 15 rpm. Both systems were set at an angle of 6°, and DO concentration was monitored continuously throughout the culture period (Figure 5). The culture set at 15 rpm had a higher concentration of DO than the culture set at 10 rpm, particularly from days 8 to 12. Indeed, the DO level of the 15-rpm culture did not fall below 60%, whereas the DO concentration of the same culture set at 10 rpm fell to 20%. Thus, setting a higher rocking rate significantly increased the amount of oxygen available to the T cells.

Figure 6: Growth kinetics of T-cell cultures rocked at either 10 or 15 rpm with a constant angle of 6°; three individual experiments are shown. Each experiment used a common static starting culture in which cells were grown for five days before being transferred to the Cellbag bioreactors. Cultures continued until days 10–12.
Effect of DO on Cell Growth
To determine whether the increase in available oxygen correlated with an increase in T-cell growth, we set up a series of side-by-side cultures and compared the growth kinetics of T cells cultured at 10 and 15 rpm for 5–7 days after an initial static culture (Figure 6). Two of the three experiments show that at 15 rpm, there was an increase in viable cell number. In the first experiment, there was a 24% increase (final reading taken at day 10 of culture), and for the second experiment there was a 42% increase (final reading taken at day 12 of culture). The third experiment showed equivalent cell growth in the parallel cultures. Taken together, those results indicate that increasing the rocking rate from 10 to 15 rpm offers a modest growth advantage for T-cell cultures.
Conclusion
Although the growth rate of T cells only moderately improved using the optimized rocking conditions, the overall impact on a complex manufacturing process and autologous patient-sample processing can be significant. Optimization of rocking angles and speed not only offers a greater yield of T cells, but also builds reliability into the culture process. By integrating these rocking conditions with other optimized elements in the culture process, a robust method can be developed ready for manufacturing setup. As T-cell immunotherapies move from an experimental procedure to one that has broad clinical application, optimization and process standardization will be key.
Sam Kale, PhD, is global product marketing manager at Cell Therapy Technologies, GE Healthcare, [email protected]; www.gehealthcare.com; www.ge.com.
You May Also Like


