Dual Sourcing of Protein A Resin to Mitigate Supply Chain Risk: A Comparative Study to Determine EquivalenceDual Sourcing of Protein A Resin to Mitigate Supply Chain Risk: A Comparative Study to Determine Equivalence

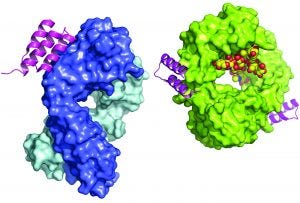
Protein A domain as a three-helix bundle binding to the heavy variable chain of a human Fab (left); minimized protein A bound to an Fc fragment (right). WIKIMEDIA COMMONS (WWW.WIKIPEDIA.COM)
Protein A affinity chromatography is a well-established technology that is used extensively for large-scale purification of monoclonal antibodies (MAbs). With this mode of chromatography, very high product purity can be achieved in a single, relatively simple unit operation. A solution containing the target protein of interest is applied to a liquid-chromatography column at near-neutral pH, and one or more wash steps follow to lower product- and process-related impurities (1). Product is eluted through application of a low-pH buffer. Finally, the resin is regenerated and prepared for use in a subsequent purification cycle.
Because of the powerful purification performance and relatively simple operation of this chromatographic step, protein A affinity resins are the foundation of MAb purification platforms (2). At Biogen, we use protein A in our MAb purification processes, and because of its critical purification function, it is the most important resin in all such processes. Following protein A capture, our purification platform consists of two polishing steps — anion-exchange (AEX) and hydrophobic-interaction chromatography (HIC) — both operated in flow-through mode.
Biogen is now constructing a state-of-the-art biologics production facility in Solothurn, Switzerland, which is scheduled for operation in 2019. This highly automated facility has been designed specifically for high-titer MAb programs (>10 g/L), so its operations will be purifying a tremendous amount of protein. The facility design is modular and based
on units of biomanufacturing cells (BMCs) that can be replicated as additional manufacturing capacity is required. In this facility, each BMC will house a large protein A column (2-m diameter) that will be cycled continuously, leading to a large annual consumption of protein A resin.
For the past several years, Biogen has relied on a single supplier for protein A resin. Recently, however, several new protein A technologies have entered the market, and some have shown performance comparable to current industry standards. To reduce the inherent risk of reliance on a single vendor for this critical material and mitigate potential interruption of drug-substance supply, we embarked on a project to identify a second protein A resin that could be used interchangeably with our platform resin. The work presented here provides an overview of the technical evaluation phase in how we selected that second protein A resin, which had to be functionally equivalent to our platform resin for the purification of a specific monoclonal antibody (MAb-A). Here we also lay out a strategy for how we envision implementing two primary protein A resins for use in a manufacturing process that complies with good manufacturing practices (GMPs).
Materials and Methods
Currently in clinical development, MAb-A is a fully humanized immunoglobulin 1 (IgG1) antibody (pI 8.77) expressed in Chinese hamster ovary (CHO) cells. Cell culture fluid containing MAb-A was produced in fed-batch bioreactors and clarified by centrifugation and depth filtration following low-pH flocculation. The clarified cell culture fluid was pH adjusted to approximately 7.0, then subjected to a detergent-based viral-inactivation step (3). The material was depth filtered one additional time before we loaded it on the protein A column.
For all bench-scale chromatography experiments, we used a GE Healthcare ÄKTA Pure 25 liquid chromatography system; for pilot-scale runs, we used a 10-mm ÄKTA Bioprocess skid. In the resin-screening phase, we used 0.66-cm ID × 10-cm bed height Omnifit columns (Diba Industries); the HCP profiling experiments used GE XK 26 columns with 20-cm bed heights. For the pilot-scale experiments, we used BPG 300 columns, also with 20-cm bed heights. All resins were packed according to their manufacturers’ recommendations.
To determine the MAb-A titer in our protein A load material, we ran a high-performance liquid chromatography (HPLC) protein G titer assay. For MAb concentration in postcapture process intermediates, we measured absorbance at 280 nm (A280) using a C Technologies Solo VPE slope spectrophotometer. To measure host-cell DNA and protein A leachate, we had qualified quantitative polymerase chain reaction (qPCR) and enzyme-linked immunosorbent assays (ELISAs), respectively. Finally, we used a product-specific ELISA and liquid chromatography with mass spectroscopic detection (LC-MS) to quantify and characterize host-cell protein (HCP) species.
Results and Discussion
Functional Equivalence and Resin Selection: Dual sourcing is not a new concept to biopharmaceutical manufacturing, but transforming the idea into practice has proven to be difficult, in large part due to difficulties in defining functional equivalence (4). At the onset of this project, we specified a set of performance attributes to help establish functional equivalence with our platform protein A resin. Thus, we considered the following criteria in the resin selection:
Equivalent drug-substance product quality
Equivalent or better process consistency
Equivalent or better dynamic binding capacity (DBC)
Equivalent or better selectivity.
Given the large variation in commercially available protein A resin technologies — including different support structures, protein A polypeptide sequences, and domain structures — we anticipated some variation in performance among them. So we placed special emphasis on intermediate and drug-substance product quality. Note that during the resin-screening phase, the same operating conditions and process solutions applied to all resins. The objective of our screening study was to identify a resin that would be comparable to our platform resin under identical operating conditions, even though resin screening revealed some resins with potentially better performance, especially with respect to DBC.

Table 1: Purification of MAb-A with several protein A resins; DNA and HCP clearance are reported as log-reduction values (LRVs); DBC = dynamic binding capacity
In resin screening, we tested four commercially available, high-capacity, base-stable protein A resins alongside our control platform resin (Table 1). From that preliminary screen, we selected resin 2 as the one that most closely matched the performance of our platform choice for MAb-A purification. DBC (reported at 10% of break-through), leached protein A, DNA and HCP clearance, and process consistency indicators (yield, eluate volume, and eluate pH) all corresponded very well. An overlay of the platform and resin-2 chromatograms further demonstrated a high degree of similarity (data not shown).
Our MAb-A capture step needed to achieve two important process consistency constraints: Acidity of the eluate pool had to be within the range of pH 3.3–3.7 without an added acidification step; and eluate volume had to be less than three column volumes (CV) to be compatible with our facility infrastructure. Resin 2 met both criteria. With resin 2 chosen as the lead secondary protein A resin, we moved on to mass-load optimization, lot-to-lot variability, and additional process impurity removal studies to complete the screening phase of this project.
HCP Tracking from Protein A Eluate to Drug Substance: Early on we had identified total HCP clearance and the HCP population in the drug substance as potential risks that could compromise drug-substance comparability when using a second-source protein A resin. To mitigate that potential risk, we conducted comprehensive impurity removal experiments to better understand the HCP populations throughout the MAb-A purification process. Using identical MAb-A harvested cell culture fluid as starting material, we completed identical purification sequences with both the platform protein A and resin 2. Samples for HCP analysis were taken at key intermediate points in each purification step: protein A load and eluate, intermediate-pH depth filtrate, AEX load, HIC load, and HIC flow-through pool. We tested those intermediates using a qualified ELISA-based HCP assay and subjected a subset of the samples (protein A eluate and HIC flow-through) to LC-MS analysis.

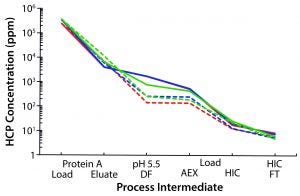
Figure 1: Waterfall chart illustrates host-cell protein clearance throughout the MAb-A purification process, comparing the platform protein A resin (hatched traces) with resin 2 (solid traces) for three different batches of protein A load material.
HCP concentration in the protein A eluate differed slightly between the two resins, with resin 2 consistently producing marginally lower levels (Figure 1). Upon adjusting the eluate pools to pH 5.5, we found that the platform protein A intermediate produced a noticeable precipitate, whereas the resin 2 sample remained relatively clear. Consequently, the HCP concentration was lower in the subsequent AEX load stage after depth filtration for the platform resin. However, after purification through the AEX column, HCP concentrations were quite low and nearly identical for both processes. Purification of different batches of MAb-A material produced similar results, whether at bench or pilot scales.
To gain a better understanding of the HCP composition in process intermediates of both processes, we used LC-MS to identify and quantitate individual species. Because the overall concentrations were very low, no single HCP species could be identified in the HIC flow-through pool regardless of which protein A resin was used. The limit of quantitation (LoQ) for a single HCP species was 10 ppm in the LC-MS assay — above the 4–6 ppm level typically measured at this intermediate stage. Thus, we profiled the HCPs in our protein A eluates, where concentrations ranged 5,000–10,000 ppm by ELISA. MS analysis of those intermediate samples produced some interesting results.

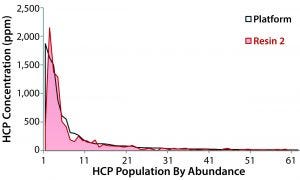
Figure 2: Concentration of individual host-cell proteins in eluates from the platform protein A and resin 2, as measured by LC-MS; platform resin data are plotted from high to low abundance (top 62 species, ≥10 ppm) with the corresponding resin 2 data superimposed. The five most abundant HCPs were laminin subunit beta-1, thrombospondin-1, clusterin, glyceraldehyde3-phosphate dehydrogenase, and chondroitin sulfate proteoglycan 4.
The most abundant HCP species identified in the platform protein A eluate also were present in the resin-2 eluate, with only slight variations in concentration (Figure 2). Regardless of which resin was used for capture, the same general population of HCPs were propagated into the rest of the purification process. These HCP profiling results further indicated that resin 2 was a good selection. Based on the differences in precipitation behavior at the intermediate-pH depth filtration step, we were somewhat surprised not to see larger differences in the HCP populations.
Resin Lifetime: One of the biggest unknowns for resin 2 was how many times it could be reused. To ensure that purification performance would be maintained over the lifetime of the resin, we carried out several developmental product cycling studies with MAb-A load material, evaluating different sanitization solutions and contact times. For this high-titer process, cleaning both protein A resins was a challenge. Both resin fouling and ligand degradation contributed to performance loss. We would need the right combination of sanitization solution strength, ligand stability enhancer, and contact time to maximize the lifetime of each resin. From our developmental cycling studies, we identified an optimal sanitization solution for resin 2 that was slightly different from the one for our platform resin.

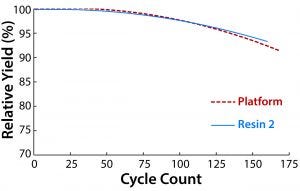
Figure 3: Comparing cycle counts of resin 2 and the platform protein A resin; impurity clearance was similar for both resins and consistent for all cycles. The sanitization solution contact time was 60 minutes for both resins
At this point in process development, a reuse lifetime had been established for the platform resin, so we used that to set the performance criterion for resin 2. Under near-identical operating conditions, both resins met the same cycle count (Figure 3). The one operating parameter that differed between them was the composition of the sanitization solution. For the platform resin, the optimal sanitization solution was 0.1 M NaOH with 1× ethylene glycol; for resin 2, we deemed 0.1 M NaOH and 0.5× ethylene glycol to be optimal for maximizing lifetime. Using the former sanitization solution with resin 2 reduced its lifetime. Given the differences in bead composition between the two resins, it is not surprising that different solutions were needed. Purification performance was maintained throughout the lifetime of both resins, even for later cycles in which some yield loss was evident.
Process Characterization: Upon establishing that resin 2 was a suitable plug-and-play substitute for our platform protein A resin, we decided to subjugate it to the same late-stage process characterization activities that had been carried out with the platform choice. This strategy is resource intensive and time consuming, but it ensures that the same technical information will be available for a regulatory filing. Deliverables from this stage of process characterization include identification of critical operational parameters; establishment of operating set points, normal operating ranges, and action limits; and development of an overall process understanding.
Before initiating process-characterization studies with the platform resin, we had completed a risk-ranking and filtering risk assessment that evaluated how different operating parameters associated with it could influence either product quality and or process consistency. We used the results of that assessment to determine the process parameters to investigate during process characterization. To identify main effect parameters, we first performed several one-factor-at-a-time (OFAT) univariate studies and a multivariate design of experiment (DoE) screening study. Those were followed by a response-surface modeling (RSM) study that enabled us to generate predictive models for different product quality and process consistency attributes. The RSM was a face-centered, half-fraction, central-composite design consisting of five input factors, two blocks, and 36 experimental runs. The RSM results identified a set of input parameters for which we could establish operating ranges and action limits.
Process characterization with resin 2 emulated that path taken with the platform resin. We reevaluated input parameters that had been eliminated from further process characterization with the platform resin for resin 2 to determine whether their exclusion was just as valid. For instances in which knowledge was lacking about the effect of one eliminated parameter, we ran additional OFAT studies. Fortuitously, the same five input parameters used to characterize the platform resin were identified for resin 2 characterization, enabling an identical RSM design.
Comparing the RSM results revealed almost identical performance, allowing us to establish the same control strategy for both resins. Only one parameter — the elution-buffer pH specification — needed to be altered slightly for resin 2 to achieve equivalent performance. Impurity clearance, formal resin lifetime, worst-case process linking, and a four-panel viral clearance validation study rounded out the process characterization phase of this project. The latter for both resins was established under identical operating conditions. Both achieved a similar degree of viral clearance, differing by <0.5 log10 for three out of four viruses and 0.6 log10 for the fourth.
A Path to Implementation
Process validation for the platform protein A resin was completed in the summer of 2017; validation of resin 2 is pending for a future manufacturing campaign. We have considered several options for how and when to introduce the latter into our manufacturing process, each with its own pros and cons. Regulatory filing timelines, manufacturing capacity, and business needs are some factors that will dictate when we will need to perform process validation with resin 2. Regardless of timing, however, the validation strategy itself will consist of full-scale process validation runs, replicating the strategy used for the platform resin. This approach is conservative, but it will provide us with manufacturing-scale data to establish that resin 2 indeed can be used interchangeably with our platform resin for MAb-A capture.
Acknowledgments
We’re grateful to Sethu Siva and Sanchayita Ghose for their contributions during the early phase of this project. Special thanks go to Suli Liu from the Biogen analytics group for generating the mass spectroscopy data and to the greater analytics department for all their support.
References
1 Singh N, Chollangi S. Next-Generation Clarification Technologies for the Downstream Processing of Antibodies. Process Scale Purification of Antibodies. Gottschalk U, Ed. John Wiley & Sons: Hoboken, NJ, 2009; 79–102.
2 Shukla A, et al. Downstream Processing of Monoclonal Antibodies: Application of Platform Approaches. J. Chromatography B. 848(1) 2007: 28–39; doi:10.1016/j.jchromb.2006.09.026.
3 Conley L, et al. Evaluation of Eco-Friendly Zwitterionic Detergents for Enveloped Virus Inactivation. Biotechnol. Bioeng. 114(4) 2017: 813–820; doi:10.1002/bit.26209.
4 Briggs J, Chandarana N. Exploring Options for Dual Sourcing of Single-Use Components. BioProcess Int. 12(11) 2014: 26–29.
Corresponding author Edward K. Koepf is a senior scientist; Greg Evangelist is a senior engineer 1 at Biogen, Inc., 5000 Davis Drive, Research Triangle Park, NC, 27709; 1-919-993-1849; [email protected]. Matthew Westoby (formerly associate director of process biochemistry at Biogen) is director of technology strategy and innovation at Juno Therapeutics, Inc.
You May Also Like


