Specification Limits for Biomanufacturing Processes: Comparing Tolerance-Interval and Process-Capability MethodsSpecification Limits for Biomanufacturing Processes: Comparing Tolerance-Interval and Process-Capability Methods
June 26, 2023
Critical quality attributes (CQAs) such as safety, efficacy, purity, and identity must be monitored and controlled in biopharmaceutical products to meet predefined specification limits. Setting such parameters is critical but challenging. Unduly narrow specification limits increase risks for rejecting good product batches, whereas overbroad limits can lead to acceptance of bad batches (1). Limited sample sizes, homogeneous results obtained from testing of raw materials exhibiting scant variability, and variability inherent to testing methodologies can add up, encouraging quality teams to establish tight specification limits. Yet doing so can create difficulties in the long term for meeting specification limits during commercial production.
Herein, I discuss and compare two of the most frequently used statistical approaches for setting specification limits. The tolerance-interval (TI) approach is based on historical process performance, whereas the process-performance index (PpK) method seeks to understand uncertainty within historical data to predict a process’s ability to meet specifications consistently. Although both methods for setting specifications have been used across the biopharmaceutical industry for a long time, most off-the-shelf statistical-software packages still do not provide prebuilt functions for the PpK method. Therefore, I also provide a step-by-step procedure for applying those statistical approaches in Microsoft Excel software, with illustrative examples for easy adaptation and implementation.
Note that statistical methods should serve as supporting tools when setting specifications. Quality teams always must consider regulatory expectations, experiences with similar products, and results from both clinical and nonclinical studies (1).
Tolerance-Interval Method
A tolerance interval is a range that gives a fixed proportion (p) of the population at a stated statistical confidence (1 – α), assuming that sample data come from a normally distributed population (2, 3).

Equations 1–9.
Two-Sided TI: A two-sided TI is expressed as shown in Equation 1. Therein, μ and σ represent the population mean and population standard deviation, respectively. The TI estimator, k, is the number of standard deviations away from the mean that covers a certain fixed proportion of the population at the desired statistical confidence.
Uncertainty with Sample Mean and Standard Deviation: Because sample sizes are limited at early stages of gathering process understanding, the true population mean and standard deviation are unknown. Uncertainty can be addressed by replacing the population mean and population standard deviation with confidence intervals for those variables. A confidence interval is a range that gives a single-valued parameter (such as the mean or standard deviation) of a population at a stated level of confidence. Confidence intervals around the mean and standard deviation are shown in Equations 2 and 3, where
• xUCI and xLCI represent the upper and lower confidence interval values for the mean
• sUCL represents the upper confidence interval value for the standard deviation
• ns is the sample size
• t((1 – α)/2), (df) represents the inverse of the cumulative t distribution
• χ2 represents the inverse of the cumulative chi-square distribution (2).
The significance (α) value or type I error often is set at an acceptable value of 0.05 (4), indicating a 5% chance of false rejection of an actually true null hypothesis. In other words, the statistical confidence (1 – α) is 100% – 5% = 95%.
Substituting Equations 2 and 3 in Equation 1 yields a two-sided TI, as shown in Equation 4. In 1969, Howe estimated the k value to be a function of sample size (n), confidence (1 – α), and proportion (p) of population to cover, as shown in Equation 5 (2), where z is the inverse of the cumulative normal distribution. Later, Guenther corrected Howe’s approximation by using k′ instead of k for smaller samples (Equation 6) (2).
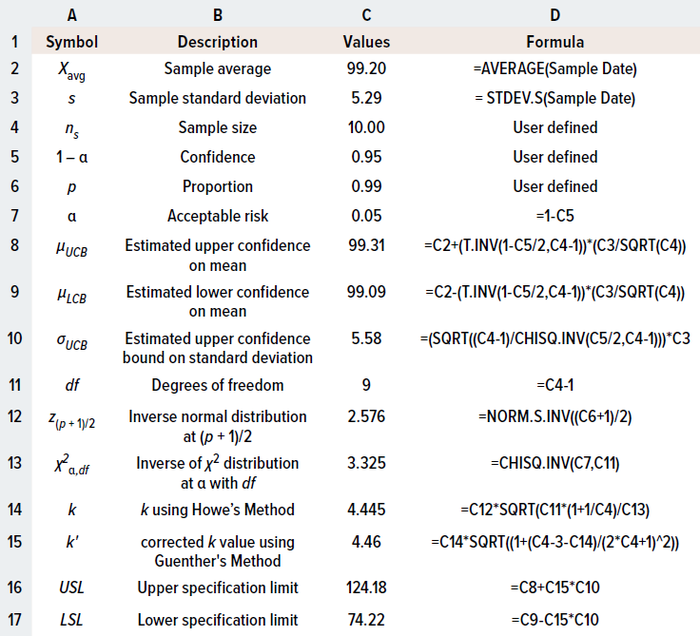
Sample Data: For the purpose of illustration, I’ve adapted drug-product potency data from Coffey and Yang, with average and sample standard deviation values of 99.2% and 5.29%, respectively, at sample size n = 10 (10). Table 1 shows how to calculate two-sided specification limits using Microsoft Excel software.

Table 1: Calculating limits for two-sided specifications using the tolerance-internal (TI) method in Microsoft Excel software.
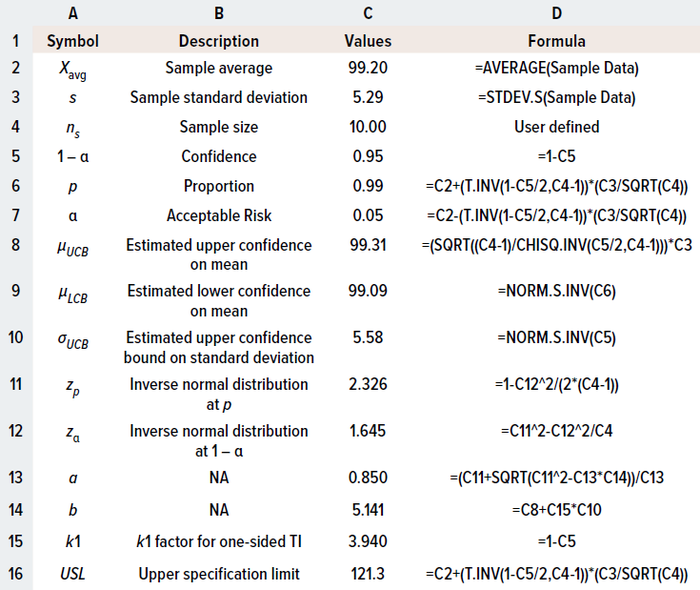
One-Sided TI: For a one-sided TI, Natreilla has given an approximate value for the k factor, as shown in Equation 7 (2). Equations 8 and 9 show how to calculate values for a and b.
To illustrate calculation of a one-sided TI, I apply the same example used for the two-sided method. Table 2 details the formulas and calculations used in a Microsoft Excel spreadsheet.

Table 2: Calculating limits for one-sided specifications using the tolerance-internal (TI) method in Microsoft Excel software.

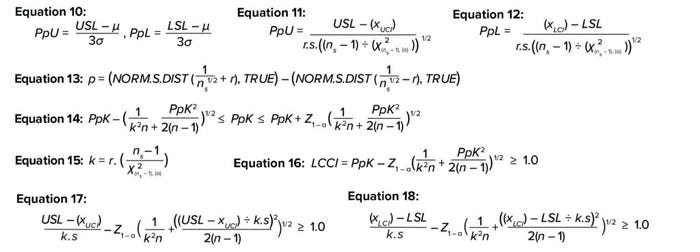
Equations 10–18.
Process-Capability Method
The ability of a process to meet predefined specifications is determined by the process-performance index (PpK), which equals the ratio of the distance from the process mean and nearest specification to the one-sided spread of the process (3σ variation), based on the overall standard deviation for a normally distributed population (6). PpK is calculated as shown in Equation 10, where
• PpL is the lower index
• PpU is the upper index
• USL and LSL represent the upper and lower specification limits, respectively (5).
Uncertainty with the Sample Mean, Sample Standard Deviation, and Sigma Factor: The above equation (10) for PpK usually is applied when the sample size is >25. However, sample sizes tend to be <25 when scientists are developing process understanding. Thus, the underlying true population mean and population standard deviation are unknown. As discussed for the TI method, uncertainty associated with using the mean and standard deviation of a small sample size can be addressed by replacing those variables with confidence intervals around the mean and standard deviation.
In the 3σ term of Equation 10, the sigma factor of ±3 represents the number of standard deviations from the mean that covers 99.7% of the true population. However, to accommodate the uncertainty involved in a limited available sample size, the ±3 term can be replaced with r, which is the number of sigma factors from the mean covering the desired proportion of the population.
By substituting Equations 2 and 3 in Equation 10, PpU and PpL can be rewritten as shown in Equations 11 and 12. The r value can be calculated iteratively by increasing it from r = 0.1 to achieve the desired population proportion (p). Equation 13 illustrates that tactic.
Uncertainty with PpK Estimation: Equation 14 depicts Bissell’s approximated confidence interval for a capability index that accommodates uncertainty for the PpK calculation (6–8). Equation 15 shows how to calculate the needed k value.
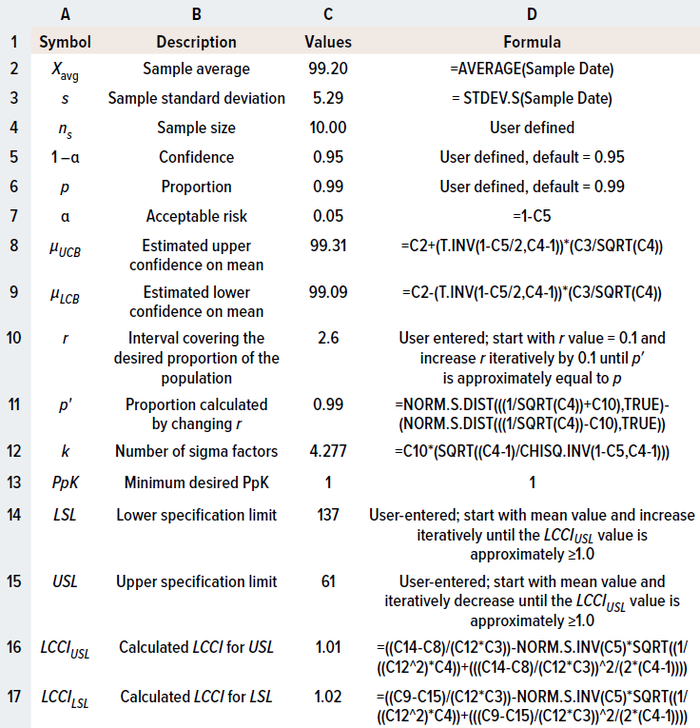
A capability-index value of 1.0–1.3 indicates that a process is capable and is likely to meet specifications routinely (5). Therefore, the specification can be calculated by iteratively changing the value of observed mean to achieve a lower capability confidence interval (LCCI) of 1.0 (Equation 16). Upper and lower specification limits to meet the minimum process capability can be calculated by solving the inequalities in Equations 17 and 18. As with previous examples, Table 3 shows the formulas needed to calculate a capability index in a spreadsheet.

Table 3: Using Microsoft Excel software to apply the process-performance index (PpK) method for calculating specifications limits.
Setting Specifications amid Uncertainty
Results in Tables 1 and 3 demonstrate that, for the same data set, specification limits calculated using the PpK method are wider than those determined by the TI method. Although the TI approach is applied more frequently, process-capability indices are recommended when detailed product knowledge has yet to be established and when narrow limits present risks for robustly meeting specification ranges during commercial biopharmaceutical production. Alternatively, the PpK method can be adopted to help justify a relatively wide product specification when preparing the postapproval section of a biological license application (BLA).
References
1 EMA/CHMP/BWP/30584/2012. Report on the Expert Workshop on Setting Specifications for Biotech Products. European Medicines Agency: Amsterdam, The Netherlands, 2019; https://www.ema.europa.eu/en/documents/report/report-expert-workshop-setting-specifications-biotech-products_en.pdf.
2 NIST/SEMATECH e-Handbook of Statistical Methods. US National Institute of Standards and Technology: Gaithersburg, MD, 2012; https://doi.org/10.18434/M32189.
3 Durivage M. How To Establish Sample Sizes for Process Validation Using Statistical Tolerance Intervals. Bioprocess Online 27 October 2016; https://www.bioprocessonline.com/doc/how-to-establish-sample-sizes-for-process-validation-using-statistical-tolerance-intervals-0001.
4 Lakens D. Calculating and Reporting Effect Sizes To Facilitate Cumulative Science: A Practical Primer for t-Tests and ANOVAs. Front. Psychol. 4, 2013; https://doi.org/10.3389/fpsyg.2013.00863.
5 TR 59. Utilization of Statistical Methods for Production Monitoring. Parenteral Drug Association: Bethesda, MD, 2012; https://www.pda.org/bookstore/product-detail/1842-tr-59-utilization-of-statistical-methods.
6 Charoo NA. Estimating Number of PPQ Batches: Various Approaches. J. Pharm. Innov. 13(2) 2018: 188–196; https://doi.org/10.1007/s12247-018-9316-2.
7 Wu CC, Kuo HL. Sample Size Determination for the Estimate of Process Capability Indices. Int. J. Informat. Management Sci. 15(1) 2004: 1–12.
8 Yang H. Emerging Non-Clinical Biostatistics in Biopharmaceutical Development and Manufacturing. CRC Press: Boca Raton, FL, 2016; https://doi.org/10.1201/9781315371726.
9 Krause SO. PCMO l01: Setting Specifications for Biological Investigational Medicinal Products. PDA J. Pharm. Sci. Technol. 69(5) 2015: 569–589; https://doi.org/10.5731/pdajpst.2015.01065.
10 Coffey T, Yang H. Statistics for Biotechnology Process Development. CRC Press: Boca Raton, FL, 2017; https://doi.org/10.1201/9781315120034.
Formerly a senior engineer at Novartis Gene Therapies, Naveenganesh Muralidharan is a senior manager for the manufacturing science and technology group at AGC Biologics, 5550 Airport Boulevard, Boulder, CO 80301; [email protected].
The views and opinions expressed in this article are those of the author and do not necessarily reflect the official policy or position of Novartis, AGC Biologics, or any of their respective officers.
You May Also Like


