A Challenge in Viral Clearance Determination: Estimation of Fifty-Percent Tissue Culture Infective Dose (TCID50) for Low Virus ConcentrationsA Challenge in Viral Clearance Determination: Estimation of Fifty-Percent Tissue Culture Infective Dose (TCID50) for Low Virus Concentrations
 Performing viral clearance studies is an important safety element of manufacturing all biopharmaceuticals expressed from mammalian cells (1). Typically, viral clearance is described as a log reduction value (LRV) and calculated as the log10 of the ratio of input to output virus load. Amounts of virus load are calculated from the volume and concentration of input and output fractions.
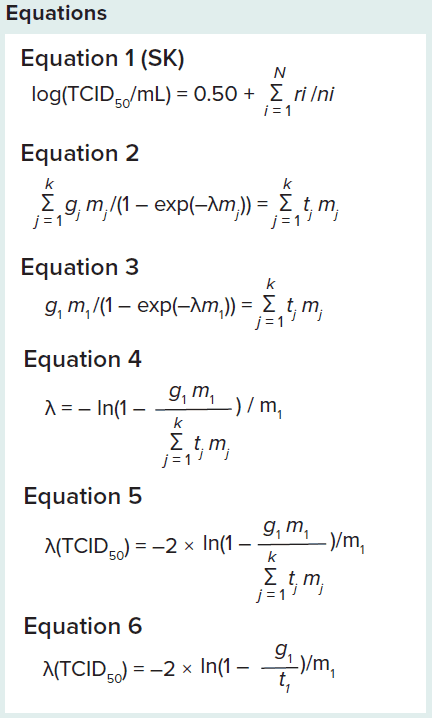
Virus concentration is often calculated as 50% of tissue-culture infective dose (TCID50) using the Spearman–Kärber (SK) equation (2, 3). In this method, replicate wells are inoculated with decreasing concentrations of test material, resulting in a transition from all wells being infected to no wells being infected. Based on the ratio of wells infected at different concentrations of test material, TCID50 is calculated. If 10-fold dilutions are applied, and each well is inoculated with 0.1 mL, the SK equation becomes Equation 1 (next page), in which ri is the number of positive wells in row i, and ni is the total number of wells in row i.
Limitations of the SK Equation
The SK equation is accurate only when a significant percentage (10–90%) of wells are infected. At lower concentrations, use of a maximum likelihood (ML) method is recommended (4). When performing viral clearance studies, low virus concentrations occasionally are observed in which the fraction of infected wells is <10%. Applying the SK equation in such cases will result in erroneous estimates of virus concentration. For large-volume plating (e.g., several 96-well plates) in which only few wells are positive, that erroneous effect becomes profound. Therefore, alternative means of calculating virus concentration for dilute samples must be devised.
Below, we present a way to estimate TCID50 for cases in which viruses are detected at low concentrations (when the SK equation would render imprecisely).
 ML Method for Low Virus Concentrations
ML statistical methods are recommended for low virus concentrations (4). These methods also are precise for high concentrations. Calculation of virus concentration using ML statistical methods is complex and involves numerical solution for virus concentration in the original sample (λ in Equation 2). In that equation, k is the number of dilutions tested, gj is the number of positive wells in dilution j, tj is is the total number of wells tested in dilution j, and mj is the volume of original sample per well in dilution j (5).
For low virus concentrations, positive wells are present only in the lowest sample dilution. In that case, the sum on the left side of Equation 3 will consist of only one factor (gj = 0 for j > 1). That allows for isolation of λ by rearranging the equation, resulting in Equation 4.
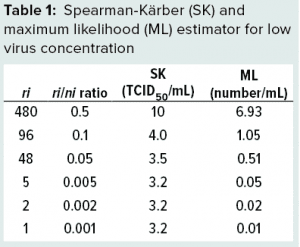
 Using Equation 4, the ML method for virus concentration (c) can be calculated easily. To illustrate that, consider a hypothetical example in which large-volume plating is performed: Undiluted process material is seeded into each well on 10 96-well plates (a total of 960 wells). Each well is seeded with 100 µL, for a total volume of 96 mL tested. For simplicity, we assume that all wells inoculated with 10× diluted material are negative. Table 1 shows results of SK and ML methods for such a case. It is evident that in this case, the SK equation does not capture the dramatic decrease in the number of positive wells. Instead, it reaches a level of about 3.2. By contrast, the ML estimator reacts to variations in the low concentration (lower rows in Table 1).
Bringing Together SK and ML Outputs
By contrast with outputs from the SK method, outputs from the ML method are not TCID50 values. Conversion of ML output to TCID50 is necessary before calculation of LRV.
Concentration calculations using ML can be converted into TCID50. Different sources suggest slightly different conversion factors. For example, Brownie et al. suggest a factor of 1.44 (or addition of 0.16 on a log scale) (4). That factor is approved by the American Type Culture Collection (ATCC) and included in the testing protocol approved by the United States Department of Agriculture (USDA) (6, 7). Wulff et al. state a conversion factor of 1.78 (8). An in-house simulation (data not shown) revealed that, in fact, the conversion factor should change slightly depending on the ratio of infected wells. At 50% infection, the factor is 1.44, but it varies between 1.28 and 1.95 for infection rates of 25–75% of wells.
For a conservative estimate, a value of 2 is chosen. In some cases, this value can provide an overestimation of TCID50 concentration, leading to underestimation of LRV in clearance studies. From a virus-safety perspective, such underestimation is acceptable. The value also is supported by the following rationale: one TCID50 will infect 50% of inoculated tissue culture wells. By contrast, one infectious unit in a well always will result in an infected well. For example, in a case of 50% of infected wells, several of those infections will arise from more than one virus particle, and the 2:1 logic will not hold. But for dilute samples (for which the probability of having two viruses in the same well is negligible), a 2:1 ratio between TCID50 and plaque-forming unit (PFU) seems reasonable. So a conservative TCID50 estimate can be obtained simply by multiplying Equation 4 by 2, resulting in Equation 5.
Using a combination of the SK and ML equations derived above enables calculation of virus titer (expressed as TCID50/mL) for both high and low concentrations. For large-volume titrations, contribution from t2m2 and higher dilutions in the sum ∑tjmj from j = 1 to j = k becomes negligible, and Equation 5 can be approximated to Equation 6. That even simpler version should be used only when large-volume titrations are applied.
Therefore, the following approaches are recommended:
If virus is detected in more than one dilution, or if virus is detected in 25% or more of wells in lowest dilution: Use SK equation as described in Equation 1.
If no virus is detected, use method described in Reference 1.
In all other cases, calculate titer as per the ML Equation 6.
References
1 ICH Q5A(R1): Viral Safety Evaluation of Biotechnology Products Derived from Cell Lines of Human or Animal Origin. The International Council for Harmonisation of Technical Requirements for Pharmaceuticals for Human Use: Geneva, Switzerland, 1999.
2 Kärber G. Beitrag zur kollektiven Behandlung pharmakologischer Reihenversuche. Naunyn-Schmiedeberg’s Archives of Pharmacology 162, 1931: 480–483.
3 Spearman C. The Method of “Right and Wrong Cases” (Constant Stimuli) Without Gauss’s Formula. Br. J. Psychol. 2(3) 1908: 227–242; https://doi.org/10.1111/
j.2044-8295.1908.tb00176.
4 Brownie C, et al. Estimating Viral Titres in Solutions with Low Viral Loads. Biolog. 39(4) 2011: 224–230.
5 Blodgett R. BAM Appendix 2: Most Probable Number from Serial Dilutions. The US Food and Drug Administration: Rockville, MD, 2010; https://www.fda.gov/food/laboratory-methods-food/bam-appendix-2-most-probable-number-serial-dilutions.
6 ATTC-LGC Standards FAQ: Converting TCID50 to Plaque Forming Units (PFU). ATTC: Manassas, Virginia, 2012; https://www.lgcstandards-atcc.org/Global/FAQs/4/8/Converting_TCID50_to_plaque_forming_units_PFU-124.aspx.
7 SAM 307.07 Supplemental Assay Method for the Titration of Feline Rhinotracheitis Virus in Cell Culture. United States Department of Agriculture Center for Veterinary Biologics Testing Protocol: Ames, IA, 2014.
8 Wulff NH, et al. Monte Carlo Simulation of the Spearman–Kärber TCID50. J. Clin. Bioinforma. 2(1) 2012: 5.
Corresponding author Anne Charlotte Arentsen ([email protected]) is senior development scientist, and Søren Kamstrup is principal scientist at Novo Nordisk, A/S. Hagedornsvej 1, DK2820 Gentofte, Denmark.
You May Also Like


