Modeling Virus Clearance: Use of a Noninfectious Surrogate of Mouse Minute Virus As a Tool for Evaluating an Anion-Exchange Chromatography MethodModeling Virus Clearance: Use of a Noninfectious Surrogate of Mouse Minute Virus As a Tool for Evaluating an Anion-Exchange Chromatography Method
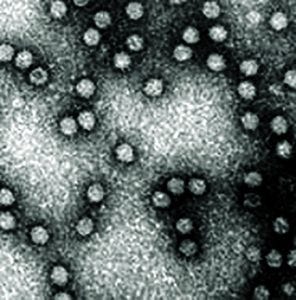
Noninfectious virus-like particles
MOCKV SOLUTIONS (HTTP://MOCKVSOLUTIONS.COM)
Viral safety is a critical focus during biopharmaceutical manufacturing (1–5). Although well-characterized mammalian cells such as the Chinese hamster ovary (CHO) line have been used for decades, both endogenous expression of retroviral-like particles and exogenous contamination events from viruses warrant continued vigilance (6, 7). International regulatory agencies require biomanufacturers to validate the “viral clearance” efficacy of their downstream manufacturing process steps before resulting products can be awarded clinical trial or commercial approval (8–10).
Currently, viral clearance testing is based on small-scale “spiking studies” in which specific model mammalian viruses are introduced artificially (“spiked”) into in-process material and subsequently removed by the specified downstream purification steps (11, 12). Spiking studies require specialized biological safety level 2 (BSL-2) laboratories with trained personnel — resulting in costs that can soar well over US$100,000 (13, 14). These hurdles deter many companies from analyzing viral clearance during the years of small-scale process development that lead to validation. Instead, such companies spend considerable resources optimizing their manufacturing processes before gaining knowledge of the viral clearance efficacy. Unfortunately, that increases the risk of validation failure, forcing biomanufacturers to invest additional time and money redeveloping some process steps — which in turn could postpone regulatory approval. Ultimately that can affect a company’s go-to-market strategy and delay patients’ timely access to therapies they need.
Using a simple, low-cost viral clearance assessment kit during small-scale process development would provide bench scientists with a unique tool to generate early viral clearance data. With a “quality by design” (QbD) approach, these scientists could be confident in optimizing the virus removal capability of purification steps in both continuous and conventional processes before their companies invest significant resources in regulatory-supporting spiking studies for viral-clearance validation. The time and resources ultimately saved by such a tool could translate into less expensive ($/gram) biomanufacturing costs for a range of therapeutic modalities and reduce existing barriers to process innovation.
MockV Solutions has attempted to address the problem using virus-like particles (VLPs) as spiking surrogates (15, 16). Noninfectious VLPs are multiprotein structures that mimic the characteristics, organization, and conformation of native infectious viruses. Those properties have made VLPs an interesting class of molecules for potential use as vaccines. The same features make them ideal for use as analytical process development tools for biosafety level 1 (BSL-1) laboratories. A VLP composed of the major capsid protein of minute virus of mice (MVM) has been demonstrated to resemble live MVM physiochemically and was used to predict MVM clearance by nanofiltration and anion-exchange chromatography (AEX) (15). Because of of its history as an actual contaminant, its physiological resistance to known inactivation treatments, and its relatively small size, MVM is among the most common model “spiking” viruses cited by international regulatory agencies to demonstrate clearance (17).
The objectives of our study were to confirm the utility of this VLP — an MVM mock virus particle (MVM-MVP) — for predicting MVM clearance by AEX and then to use the noninfectious particle in mapping the associated process design space through a design of experiments (DoE) study.
MATERIALS AND METHODS
Monoclonal Antibody Preparation: GlaxoSmithKline produced the test monoclonal antibody (MAb) using NS0 cells, with harvest and purification by standard preparative protein A affinity chromatography. Further purification steps removed additional impurities, then samples were frozen at –80 °C.
MVM-MVP Stock and Antibody: MVMMVP is produced by recombinant expression of MVM’s major capsid protein (VP2) and purified according to published methods (15, 16). Negative-staining transmission electron microscopy (TEM) is used to determine MVM-MVP titer. A stock solution of MVM-MVP was prepared by diluting the preparation to 12.0 log TEM counts/mL (1.0 × 10¹² particles/mL) with a proprietary formulation buffer.
Monoclonal antibodies (MAbs) against MVM-MVP were generated by immunizing female BALB/cAnNHsd mice with MVM-MVP. Hybridomas were created by fusing spleen cells to NS1 myeloma cells using standard polyethylene glycol (PEG)-induced fusion methods. After screening, subcloning and isotyping, a highly specific and sensitive MAb-producing hybridoma was selected. Antibodies from that hybridoma were produced in vitro using CL1000 bioreactors (Wheaton catalog #WCL-1000). Cell culture supernatant containing secreted MAbs was harvested and clarified for purification through a standard protein-G affinity chromatography method. Eluted immunoglobulins were pH neutralized, quantified spectrophotometrically, and dialyzed into an appropriate buffer.
Immuno-qPCR Analysis of MVM-MVP: We used a novel immuno-qPCR (I-qPCR) assay to measure the MVM-MVP quantity of experimental samples generated during our study: In this method, samples are added to microwells coated with anti-MVM-MVP MAbs (described above). After incubation in a 37 °C water bath for 30 minutes, the wells are washed, and a DNA-conjugated anti- MVM-MVP detector MAb is added. Following a second 37 °C, 30-min incubation and wash step, a proprietary recovery buffer is added to each well for five minutes. Then 5 μL of sample is transferred from each well and added to a qPCR plate containing a master mix from QuantaBio with water and primes/ probe directed against the conjugated DNA. We use an AB 7500 Fast system (Applied Biosystems) for qPCR according to set cycling parameters. To determine the quantity of particles in unknown samples, threshold cycle (Ct) values are interpolated into a standard curve generated by including a 10-fold dilution series of a known MVM-MVP standard during each I-qPCR analysis.
To test intraassay variability, we analyzed samples on multiple occasions.
Live MVM: MVM strain prototype P was propagated at Texcell NA. Initially, A9 cells were grown in serum-free media and their expressed viruses subsequently purified by ultracentrifugation and mixed-mode chromatography. Titer was assessed with a validated TCID50 infectivity assay.
AEX Chromatography Spiking Experiments: An AEX resin (Q Sepharose FF) was packed into 30 × 0.66 cm columns and qualified. Two preliminary nonspiked experiments were conducted to establish baseline performance. We adjusted 100 mL of MAb material to a pH of 7.0 and conductivity of 3.0 mS/cm, to a pH of 7.5 and conductivity of 8 mS/cm, and to a pH of 8.0 and conductivity of 13.0 mS/cm. Then we processed and chased each sample through a column equilibrated to pH 7.5. at a flow rate of 150 cm/h. Flowthrough pool was collected according to set UV280 absorbance criteria, and we calculated the percent yield. After pool collection, we cleaned and stored the column.
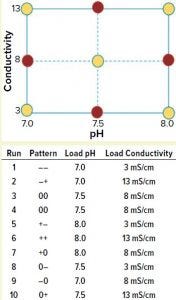
Figure 1: A full-factorial, central composite face design of experiment (DoE) examining load pH and conductivity was constructed. Nonaxial-point runs 1–6 (yellow) were spiked with MVM-MVP and MVM in parallel, whereas axial-point runs 7–10 (red) were spiked only with MVM-MVP.
We used a full-factorial design of experiments (DoE) study with two center points to analyze the effects of pH and conductivity on MVM and MVM-MVP clearance (Figure 1, runs 1–6). Four additional runs used MVM-MVP spike at the axial points (Figure 1, runs 7–10) to detect potential second-degree curvature. Load material was adjusted to the respective run conditions, spiked with either MVM or MVM-MVP, and purified through the Q Sepharose FF columns.
To test for potential MVM-MVP quantification assay interference, we adjusted MAb material to the nonaxial pH and conductivity conditions described in Figure 1, then spiked to a concentration of 8.0 log particles/mL, assayed “neat,” and diluted 1:2 and 1:10 (with a proprietary assay diluent) by Immuno-qPCR (detailed above). Next, we spiked 110 mL of each conditioned load (nonaxial and axial, Figure 1 runs 1–10) with 0.9% (v/v) of MVM-MVP stock solution (12.0 log particles/mL) to achieve a concentration of 9.95 log particles/mL. After sampling, we processed ~90–100 mL of each spiked load through a Q-SFF column under the same general conditions outlined above for the preliminary experiment. We performed a duplicate of each nonaxial MVM-MVP spiked experiment (runs 1–6). For nonaxial experiments, we challenged 100 mL of conditioned loads with a 0.08% (v/v) spike of live MVM, resulting in load concentrations of ~7.5 log TCID50/mL and processed them accordingly. Samples from MVP- and MVM-spiked runs were stored at –80 °C until analysis by I-qPCR as discussed above or by standard TCID50 infectivity assay, respectively. From those results, we could determine log-reduction values (LRV) and make clearance comparisons.
DoE Analysis: Our six-run, full-factorial DoE study results analysis yielded a nonsignificant linear regression model. We modeled our analysis of the 10-run MVP central composite design study with respect to conductivity and pH, using a backward stepwise regression method. Then we could test the resulting model’s statistical significance using analysis of variance (ANOVA) and effects tests, performing each test at a significance level of 0.05. We evaluated model quality using a lack-of-fit test and an actual by predicted plot.
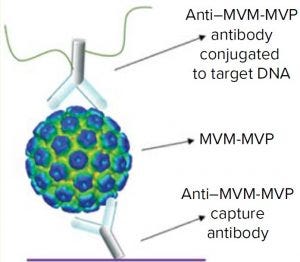
Figure 2: Schematic of the I-qPCR assay developed and used during this study
This model was intended to confirm the qualitative trends observed rather than being used as a predictive model.
RESULTS AND DISCUSSION
I-qPCR Performance: To quantify MVM-MVP concentrations and determine the LRVs after each spiking experiment, we analyzed samples by I-qPCR. Previously reported MVM-MVP studies used a polyclonal-antibody– based I-qPCR assay that required a three-step biotin–neutravidin detection strategy (16). That published assay enables detection of particles within a 3.0 log dynamic range (106–109 particles/mL) and requires about nine hours to operate.
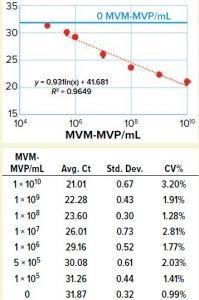
Figure 3: Table shows average Ct values derived from 10-fold dilution series (n = 5) with standard deviation and coefficient of variation in the table. Graph compares MVM-MVP particle concentration with average Ct values showing 95% confidence interval error bars. A standard curve was generated (orange dotted line), and the background assay signal (0 particles/mL, buffer only) is depicted by the solid blue line.
We took a more streamlined approach by directly conjugating the qPCR target DNA sequence to an anti– MVM-MVP detection MAb (Figure 2). Results from five separate MVM-MVP standard dilution series runs over the course of our entire study demonstrate good intraassay consistency (Figure 3). According to a Student t-test, the average Ct value at a concentration of 5.0 × 10⁵ particles/mL was statistically different (p = 0.0046) from the average Ct value of buffer alone (0 particles/mL). Thus, we used a value of 5.0 × 10⁵ particles/mL as the assay’s lower limit of quantification (LLoQ) when establishing a standard curve from which the concentration of unknown samples could be determined. This LLoQ also served as a minimum value to be used when determining LRV from samples in which no particles were detected. Overall the assay’s dynamic range spanned 4.5 log, which is a significant improvement over the previous assay, and it requires half the time to perform (about four hours).
Spike and Recovery: Before conducting chromatography experiments, we determined the I-qPCR assay interference by spiking MVM-MVP into conditioned MAb loads (conditions of runs 1–6 in Figure 1) and testing “neat”(diluted 1:2 and 1:10 via I-qPCR). The results indicated that 1:10 dilutions of each load preparation would yield nearly 100% recovery (data not shown). Moving forward, all analyses used load samples diluted 1:10.

Figure 4: Table lists average log-reduction values (LRVs) obtained from I-qPCR or TCID50 analysis of load/pool samples from each experiment. Graph shows LRVs grouped by pH and conductivity levels (values are averages for MVM-MVP runs at each condition, n = 2). Run 4 is not included. Error bars represent 95% confidence intervals, and upward arrows depict complete clearance achieved.
Comparing MVM-MVP and MVM: We challenged conditioned MAb loads (runs 1–6 in Figure 1) with MVM-MVP or live MVM and processed them through Q-SFF columns in parallel (MVM-MVP runs performed in duplicate for each condition). We analyzed load and flowthrough samples collected during each run by I-qPCR or TCID50 infectivity assay, respectively, for each spike type and determined the resulting LRVs (Figure 4). Our results demonstrate that at pH 7.0 and a conductivity of 3.0 mS/cm, LRVs of ~4.0 for both particle types were achieved; increasing conductivity to 13.0 mS/cm resulted in a significant drop-off in clearance for each particle type. At center-point conditions (pH 7.5, conductivity 8.0 mS/cm), both particle types were shown to be completely removed by the AEX resin. For run 4, however, an MVM LRV of only 4.27 was achieved with a shorter column.
Complete removal of both particle types was seen again at pH 8.0 and conductivity of 3.0 mS/cm; at a higher conductivity, only MVM-MVP was removed completely (residual MVM was detected by infectivity assay yielding an LRV of 3.24). Overall, the MVM-MVP particle demonstrated its ability to predict MVM clearance accurately. Duplicate runs of each MVM-MVP experiment served to demonstrate robustness of the overall technique because consistent LRVs were achieved more often than not.
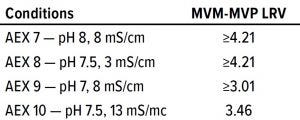
Table 1: LRV results from axial runs 7–10;
pool sample for run 9 was diluted 1:10, thus
constricting the reportable LRV.
Design Space Process Mapping: In addition to runs 1–6 described above, and to allow for the inclusion of curvature in a regression model, we conducted four MVM-MVP spiking “axial-run” experiments as per the original DoE. Using JMP software, we analyzed LRV results from runs 7–10 (Table 1) along with the LRV values from the original runs 1–6.
For most AEX conditions we tested, neither MVP nor MVM was detected in flowthrough pools either because of complete clearance or assay limits of quantification (LoQ). That presented a challenge in determining LRV values and modeling viral clearance. For the sake of creating a model, we assumed all MVM and MVM-MVP results that demonstrated completed clearance to have particle concentrations equal to the LoQ. Then we designated the resulting LRV values as “≥” to signify that the calculated LRVs were lower. In the statistical analysis and comparing MVM with MVM-MVP, we treat those “greater than” LRV values as if they are the real values, thus providing a worst-case model for viral clearance. Although such a strategy may seem controversial, the purpose of our model is to create a qualitative design space process map rather than to provide a quantitative regression model.
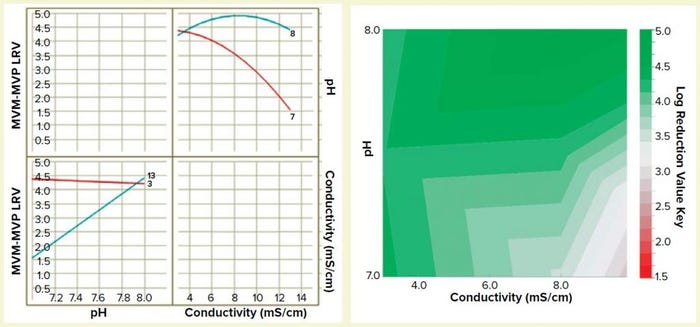
Figure 5: Interaction plot (left) and design-space process map (right) illustrating the effects of pH and conductivity on MVM-MVP clearance
We built a statistically significant and valid model from the data set (R2 = 0.92, p < 0.01, no lack of fit). And we constructed a two-dimensional (2D) response surface graph and interaction plot (Figure 5) to show the general trend of LRV outcomes when operating with different load pH and conductivity parameters. The results demonstrate that load pH has strongly influences load conductivity’s effect on LRV, and vice versa. At pH 8, the conductivity range of 3–13 mS/cm had little effect on viral clearance; at pH 7, conductivity has a high impact on viral clearance. The surface plot diagram shows that higher conductivities and lower pH values resulted in worse viral clearance — results that aligned with our previous expectations for MVM clearance using AEX. By generating this model in future process development efforts, we can prevent use of operating parameters that do not allow for robust viral clearance.
TIME AND MONEY SAVED
In this study, we sought to establish a noninfectious MVM-MVP surrogate as an accurate predictor for MVM clearance by AEX chromatography, and then use that surrogate as a means to establish a process design space. Generated data proved our attempt to be a success in both aspects. Using DoE and MockV’s MVP surrogate, we gained an understanding of the impacts that our critical process parameters have on MVM clearance. The data we generated would have required at least 10 smallscale MVM spiking runs at a contract testing laboratory costing at least US$50,000 and requiring at least a month of planning and logistics. Because of the noninfective nature of the MVM-MVP, we could conduct the entire MVM-MVP portion of the study entirely “in-house” over the course of about a week. Overall, these results demonstrate the feasibility and value of using MVP technology as a costeffective, accurate, and rapid means to accelerate downstream process development efforts in biopharmaceutical manufacturing.
ACKNOWLEDGMENT
Research reported herein was supported by the National Center For Advancing Translational Sciences (US National Institutes of Health) under Award R43TR002231. The content is solely the responsibility of the authors and does not represent the official views of the NIH.
REFERENCES
1 Darling A. Validation of Biopharmaceutical Purification Processes for Virus Clearance Evaluation. Mol. Biotechnol. 21(1) 2002: 57–83.
2 Ray S, Tarrach K. Virus Clearance Strategy Using a Three-Tier Orthogonal Technology Platform. BioPharm Int. 21(9) 2008.
3 Nims RW. Detection of Adventitious Viruses in Biologicals: A Rare Occurrence. Devel. Biologic. 123 (2006): 153–164.
4 Nims RW, et al. Detection of Cache Valley Virus in Biologics Manufactured in CHO Cells. BioPharm Int. 21(10) 2008.
5 Burnouf T, et al. Place of Nanofiltration for Assuring Viral Safety of Biologicals. Curr. Nanosci. 1(3) 2005: 189–201.
6 Lieber MM, et al. Mammalian Cells in Culture Frequently Release Type C Viruses. Science 1973: 56–59.
7 Merten O-W. Virus Contaminations of Cell Cultures: A Biotechnological View. Cytotechnol. 39(2) 2002: 91–116.
8 CBER. Points to Consider in the Manufacture and Testing of Monoclonal Antibody Products for Human Use. US Food and Drug Administration: Rockville, MD, 1997; www.fda.gov/downloads/Biologics BloodVaccines/GuidanceCompliance RegulatoryInformation/Other RecommendationsforManufacturers/ UCM153182.pdf.
9 EMEA/CHMP/BWP/398498/2005-corr. Guideline on Virus Safety Evaluation of Biotechnological Investigational Medicinal Products. European Medicines Agency: 28 June 2006; https://www.ema.europa.eu/en/ documents/scientific-guideline/draftguideline-virus-safety-evaluationbiotechnological- investigational-medicinalproducts_en.pdf.
10 ICH Q5A: Viral Safety Evaluation of Biotechnology Products Derived from Cell Lines of Human or Animal Origin. US Fed. Reg. 63(185) 1998: 51074; www.ich.org/ fileadmin/Public_Web_Site/ICH_Products/ Guidelines/Quality/Q5A_R1/Step4/Q5A_R1__Guideline.pdf.
11 Aranha H, Forbes S. Viral Clearance Strategies for Biopharmaceutical Safety. Pharma. Technol. 2001.
12 Shukla A, Etzel M, Gadam S. Process Scale Bioseparations for the Biopharmaceutial Industry. CRC Press: Boca Raton, FL, 2007.
13 Taylor P. Cutting the Cost of Viral Clearance Testing. BioPharma Reporter 2008; www.biopharma-reporter.com/Article/2008/ 06/09/Cutting-the-cost-of-viral-clearancetesting.
14 Connell-Crowley L, Larimore EA, Gillespie R. Using High Throughput Screening to Define Virus Clearance By Chromatography Resins. Biotechnol. Bioeng. 110(7) 2013: 1984–1994.
15 Johnson S, et al. Characterization of Non-Infectious Virus-Like Particle Surrogates for Viral Clearance Applications. Appl. Biochem. Biotechnol. 183(1) 2017: 318–331.
16 Cetlin D, et al. Use of a Noninfectious Surrogate to Predict Minute Virus of Mice Removal During Nanofiltration. Biotechnol. Progr. 34(5) 2018: 1213–1220.
17 Romanowski P, et al. Variables Affecting Titer and Long-Term Stability of Virus Stocks. BioProcess Int. 2008: 44–52.
Corresponding author Kevin Herbig is a biopharmaceutical technology scientist; Jilcia Johnson is a biopharmaceutical technology investigator; Steven Brown is a biopharmaceutical technology scientist; Raye Melka is biopharmaceutical technology manager at GlaxoSmithKline, 9910 Belward Drive, Rockville, MD 20850; [email protected]. David Cetlin is chief executive officer, and Dale Dembrow is director of chemistry, manufacturing, and controls at MockV Solutions, 1 Church Street, Suite 801, Rockville, MD 20850; [email protected].
You May Also Like


