Balancing the Statistical TightropeBalancing the Statistical Tightrope
April 1, 2012
During one development meeting early in my industrial career, a process development group member asked me whether the value my group had reported in one result was okay to use. I confidently replied “Yes, it’s fine. It’s about 40, somewhere between 38 and 42. The other person raised his eyebrows. “About 40?” In response, I somewhat awkwardly mumbled “Yes, probably…about that” — an answer not met with full understanding, but rather concern.
My answer hadn’t been incorrect. The result was about 40, give or take a bit. Perhaps I should have said the word exactly in those circumstances, but that would not have reflected my confidence at the time. The exchange bothered me. I knew I was “about” right and understood the variance around our result, but I didn’t articulate it clearly. After some thought, I concluded that my understanding was inadequate, so I needed to try better understanding biostatistics. At the time, I never questioned whether doing so would add value to my part in the business of making medicines. And thus began my time-consuming “apprenticeship” in biostatistics.
PRODUCT FOCUS: ALL BIOLOGICS
PROCESS FOCUS: MANUFACTURING
WHO SHOULD READ: PRODUCT/PROCESS DEVELOPMENT AND ANALYTICAL PERSONNEL
KEYWORDS: QUALITY BY DESIGN, PROCESS ANALYTICAL TECHNOLOGY, BIOASSAYS, DESIGN OF EXPERIMENTS, ANALYTICAL METHODS, AND ASSAY DEVELOPMENT
LEVEL: BASIC

Figure 1: ()
Here Bloom’s Taxonomy provides useful insight (1). Figure 1 shows it as a four-quadrant box with consciousness on the side axis and competence on the top. The first quadrant contains unconscious incompetence. Essentially that means you don’t know what you don’t know. The second is conscious incompetence, when you become aware of the gaps in your knowledge. The third is conscious competence, when a level of competence has been achieved that requires much concentration to maintain it. Finally comes unconscious competence, when an activity can be performed with little conscious thought. That’s like when you’ve driven somewhere but have little recollection of the journey.
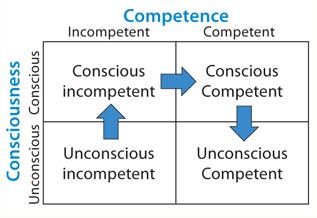
Figure 1:
With analytical statistics firmly rooted in the “conscious incompetence” box, I began my journey toward competence.
Statistics: Why Bother?
Do we really need to build a statistical understanding of analytics (and bioassays in particular)? I believe so. Biological assays are key to developing and manufacturing modern medicines and companion diagnostics. However, such assays are widely acknowledged as among the most difficult tests to perform with accuracy and precision. So although statistics won’t improve an assay itself, it should help you understand an assay’s performance. If that’s understood, then you can determine whether you have control over the assay, which in turn allows you judge the risk of using it. There is help for doing so. Regulators around the world have published many guidances encouraging quality by design (QbD), and the “Selected Guidance” box lists a few.
The Complete Solution? Application of statistical approaches to analytical method development and validation will bring benefits, but it cannot fundamentally change the performance of an assay. Using statistics to validate a poorly performing assay will simply confirm how poor it is — or provide needed illumination to help you understand how to improve it. If an assay was designed badly from the start, then it is likely to be problematic in the future regardless of what statistical evaluation is performed. Getting the design correct at the beginning — using the right tools and the right statistics — is fundamental and likely to reap dividends. Building understanding into your assay brings control or at the very least a clear view of whether it will fit its intended purpose.
Controlling the Assay: Variability in analytical results is likely to come from process variation, assay variation, and assay inaccuracy. An out-of-control assay can make a perfectly good batch fail specifications. Of course, the opposite is also true: A bad batch can get past a less-controlled test suggesting that it is within specification (Figure 2). So an assay’s precision and accuracy must be known relative to the specification. And first, the assay must be understood.
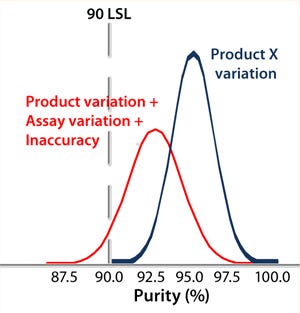
Figure 2:
Data-Driven Development: A common complaint from biostatisticians relates to scientists emailing them large, unstructured spread sheets of data in hopes that they can transmogrify the information into something useful (Figure 3). Unfortunately, that is rarely the case, so it’s the wrong approach. Often the experiments were poorly thought out statistically to begin with. Furthermore, biostatisticians in such cases have little or no insight into the work performed by the scientists — or even their objectives.

Figure 3:
A statistician should become involved at an early stage so a genuine partnership is formed between scientist and statistician. This could be a corporate statistician or an independent consultant — preferably with some previous exposure to assay development. That allows a statistician to listen and gain insight into and understanding of a scientist’s work. Ultimately, the scientist is the expert on a given assay, so he or she needs to retain responsibility for its design and outcome. However, these interactions will largely affect experimental design, both adding value and minimizing time and effort, as well as preventing basic design errors.
An Assay Development Strategy
It’
s important to use the same assay development strategy from beginning to end. Questions must be asked up-front about an assay’s use and objectives and what it specifically must achieve. Scientists use their experience to identify the control, noise, and experimental (CNX) parameters. It is vital to understand their impact, regardless of your ability to control them. Ruggedness measures the impact of noise upon an assay (e.g., batch-to-batch differences and variation among analysts). We also need to understand robustness around the parameters that can be controlled (e.g., pH, time, and temperature).
A Five-Step Program: Five steps should be followed through the development phase to ultimately validate a robust and reliable assay for routine use: prioritize and scope, screen, optimize, validate and verify, and routinely monitor. Very often, scientists developing an assay will skip immediately to the validate-and-verify step. As companies increasingly depend on contract research and manufacturing organizations (CROs, CMOs), poorly developed assays are often “thrown over the wall” to contract staff, who then have the unenviable job of trying to use it to meet a specification or try to validate it. A CEO I once worked for commented on one failing assay that we’d subcontracted out to a CRO, “I don’t see the problem. We gave them the assay. They only have to validate it?” Eventually, it came as no surprise when that CRO kicked the assay back to us.
However, if these five steps are followed diligently, then the end result is likely to be a well-controlled and capable assay that shouldn’t present any nasty surprises during validation — in other words, QbD. Validation should never be an uncertain or risky activity; a developer should be almost 100% confident that his or her assay will perform as expected. Short-circuiting of this process can turn validation into an unnecessary game of Russian roulette.
Selected Guidance
Pharmaceutical CGMPs for the 21st Century
Process Analytical Technology (PAT)
ICH Q2: Validation of Analytical Procedures
ICH Q8: Pharmaceutical Development
ICH Q9: Quality Risk Management
USP Chapter <111> Design and Analysis of Biological Assays
Prioritization and Scoping: Many parameters can be considered for a bioassay, but which are most important? Systematic testing of every possible parameter using factorial design often isn’t practical given the number to be assessed; n parameters require 2n experiments. So the number of experiments can spiral upwards to an impractical number as the number of parameters to be studied increases. Thus, it is vital for scientists to think through each assay using their experience and published literature. That allows for identification of those parameters most likely to be important, with practical considerations funneling them down to a manageable number. Ishikawa (“fishbone”) diagrams can be useful in this process — even more so if they are used with a “traffic-light” system in which parameters are considered to be low, medium, and high priority (Figure 4). Such an approach might seem a bit arbitrary or empirical, but a scientist’s experience is paramount for effective prioritization and scoping.
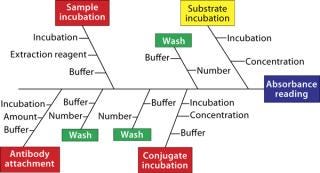
Figure 4: ()
To what extremes should each parameter be tested? Should pH be evaluated between 2 and 12 or between 6 and 8? There is no general answer here. A scientist’s judgment and experience will help him or her set limits that stretch an assay far enough to see differences without that assay failing all the time. This is where a scoping study is most effective.
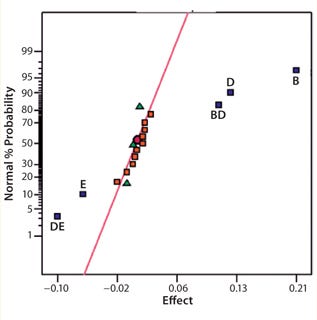
Figure 5:
Screening Out Potentially Critical Parameters: Before optimizing an assay, it is essential to screen the parameters and identify those that are potentially critical as well as to look for interactions (synergies or antagonisms) among them. A number of statistical software packages from Minitab Inc., SAS (JMP), and Stat-Ease, Inc. (Design Expert) all enable assay developers to effectively perform design of experiments (DoE) for screening parameters as well as assay optimization and robustness determination.

Figure 6: ()
Screening involves running a series of experiments in which the parameters identified during prioritization and scoping are assessed or “screened out” to reveal which are truly critical. Two-level fractional factorial designs are commonly used to screen typically five to 10 parameters that can be assessed simultaneously. Once we have identified the most important among them, we can then look to optimize those. It can be tempting to stop at this point under the misapprehension that the essential elements of an assay are understood and may be easily controlled. However, that can be premature if an assay isn’t fully understood or controllable. So it is important to consider an optimization step.
Optimization: In the past, one-factor-at-a-time (OFAT) was a common approach to optimization. However, the use of factorial designs has enabled more efficient and better control of assay performance. In my experience, a sequentially assembled response-surface design dramatically reduces the number of experiments needed to determine optimal settings for each of a set of parameters in combination. Data analysis often reveals a robust optimum that can be achieved. So a compromise may be required between optimized responses and assay reproducibility. Although maximum sensitivity may appear to be the goal, a reliable assay is often equally (if not more) important. Operational issues can also be taken into account: e.g., reducing the amount of an expensive reagent or minimizing assay time and increasing throughput. The response-surface design effectively allows scientists to set parameters that deliver the ideal set of responses to simultaneously satisfy an assay’s regulatory, technical, and operational requirements.
Validation and Verification: Once an assay’s “performance space” has been modeled,
it must be validated and verified. Evaluate the assay according to ICH Q2 (R1), performing a few experiments in which the method’s parameters are deliberately varied and assessed against the model to confirm that it performs as predicted. Target levels of specific parameters (e.g., time, pH, and concentration) then can be set. Control boundaries should be determined for all settings. Even if parameter settings are changed (intentionally or otherwise) their impact on assay performance is understood, and those boundaries can help you make a well-informed decision as to whether a result is valid. Such performance knowledge can also help identify when an assay is likely to have produced an out-of-specification (OOS) result.
Monitoring and Routine Use: Once the first four steps are complete, then you should be able to use your assay routinely with a high level of confidence. But sometimes there can be an unwanted surprise in store. So monitoring assay performance over time remains important: with both critical and noncritical parameters recorded along with documenting who performed the assay, reagent batch numbers, materials, and so on. Control charts such as those devised by Shewhart, Levey–Jennings, or CUSUM charts (3,–5) are invaluable tools for this. Routinely recording and reviewing reference control values produced by an assay relative to specifications ensures that it performs capably within expected and required limits.
Precision Matters
Although you can control certain parameters, you have less or no control over others: e.g., day-to-day, analyst-to-analyst, or batch-to-batch variability. You may be unable to completely control or remove such variation, but you can control replication. It is important to understand the sources of variation contributing to assay imprecision and inaccuracy. This is typically referred to as precision analysis. Here the variation introduced by such things as different analysts, days, equipment, and laboratories is dissected and decomposed. However, the contribution to variance that each element introduces can vary by assay. So it is essential that their contributions are understood through a variance components analysis or analysis of variance (ANOVA). Figure 7 shows a typical nested design for precision analysis. Those and subsequent analyses can be found in tools from companies such as Prism Training and Consultancy Ltd. (Nested and Cellula).

Figure 7: ()
If an assay’s performance is assessed through a nested design, then information will be derived that allows the variance contribution of each factor to be understood (Figure 8). If multiple repeats are performed, but their contribution to total variance is minimal (compared with, say, sample preparations), then practical efforts should focus on testing large numbers of samples, with limited replication performed on each sample (Figure 9). Significant time and effort can be saved while reducing assay variance and/or improving precision.
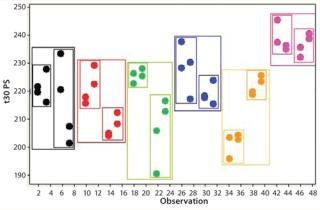
Figure 8: ()
AStatistical Apprenticeship?
How far should a scientist go in understanding and applying statistical approaches? There is no straightforward answer to that question; it very much depends on the individual as well as what value is likely to be added by that person to the business of making medicines. You don’t have to embark on a biostatistics apprenticeship. Biostatistics is a vocation and not something that can be easily picked up and put down at will. Engaging a professional biostatistician(s) can provide your company with fundamental statistical expertise. Analytical scientists need to forge strong relationships with such individuals, tapping into the additional tools at the statistician’s disposal as and when necessary. You can thus build knowledge around those activities that clearly benefit from statistics without spending large amounts of time and money for a member of your staff to become a statistician.
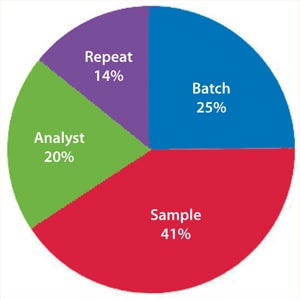
Figure 9:
Although I managed to build my knowledge of statistics up to what I thought was a fairly competent level, through lack of routine use and changing priorities, some of that hard-earned knowledge has inevitably become rusty. Consequently, I fell back to my resting state of conscious incompetence in a few areas. Still, what I have learned is that if I were back in that development meeting all those years ago and asked to confirm the result, then this time I would confidently answer, “Yes: It’s 42, of course!” (±0.05 with 95% confidence for you statisticians out there).
About the Author
Author Details
Dr. Lee Christopher Smith is founder of GreyRigge Associates Ltd., 10 Chaffinch Close, Wokingham, RG41 3HN, UK; 44-118-979-1169; [email protected]. Diagrams shown in this article were produced using statistical software packages Design Expert DX8 from Stat-ease (www.statease.com) and CELLULAand NESTED from Prism TC (www.prismtc.co.uk).
REFERENCES
1.) Bloom, BS. 1956. Taxonomy of Educational Objectives: The Classification of Educational Goals, Longmans, Green, New York.
2.) Gonick, L, and W. Smith. 2005.The Cartoon Guide to Statistics, Collins Reference, New York.
3.) Shewhart, WA. 1931.Economic Control of Quality of Manufactured Product, Van Nostrand, New York.
4.) Levey, S, and ER. Jennings. 1950. The Use of Control Charts in the Clinical Laboratory. Am. J. Clin. Pathol. 20:1059.
5.) CUSUM 1954.. Continuous Inspection Schemes. Biometrika ES 41:100-115.
6.) Rathore, AS, and H. Winkle. 2009. Quality By Design for Biopharmaceuticals. Nat. Biotechnol. 27:26-34.
7.) ICH Q
2(R1) 1997. Validation of Analytical Procedures: Text and Methodology. US Fed. Reg. www.ich.org/fileadmin/Public_Web_Site/ICH_Products/Guidelines/Quality/Q2_R1/Step4/Q2_R1__Guideline.pdf 62:27463-27467.
8.) ICH Q6B 1999. Specifications: Test Procedures and Acceptance Criteria for Biotechnological/Biological Products. US Fed. Reg. www.ich.org/fileadmin/Public_Web_Site/ICH_Products/Guidelines/Quality/Q6B/Step4/Q6B_Guideline.pdf 64:44928.
9.) CDER/CVM/ORA 2004. PAT: A Framework for Innovative Pharmaceutical Development, Manufacturing, and Quality Assurance, US Food and Drug Administration, Rockville.
10.) Chow, S, and J. Lui. 1995.Statistical Design and Analysis in Pharmaceutical Science: Validation, Process Controls, and Stability, Marcel Dekker, Inc, New York.
11.) Haaland, PD. 1989.Experimental Design in Biotechnology, Marcel Dekker, Inc, New York.
You May Also Like


