In 2012, the United States Pharmacopeia (USP) published a complementary set of three guidance documents on the development, analysis, and validation of biological assays (1,2,3). USP chapter <1033> recommends a novel, systematic approach for bioassay validation using design of experiments (DoE) that incorporates robustness of critical parameters (2). Use of DoE to establish robustness has been reported (4,–5), but to our knowledge its use in qualification or validation protocols for assessing assay accuracy, precision, and linearity is not described in literature. A validation approach incorporating different levels of critical assay parameters provides a more realistic representation of how an assay will perform in routine testing.
After initial development of a cell-based bioassay to enable an investigational new drug (IND) application, we used a DoE-based approach to perform a comprehensive qualification of that bioassay to estimate its accuracy, precision, linearity, and robustness. Such an approach to qualification requires experimental and statistical effort similar to that of traditional validation for cell-based bioassays (6,7,8), but the additional insights we gained have led us to adopt this new approach as our standard method for qualifying bioassays. Here we outline our approach and describe its benefits and challenges.
PRODUCT FOCUS: BIOPHARMACEUTICALS (antibody–drug conjugates)
PROCESS FOCUS: MANUFACTURING
WHO SHOULD READ: PROCESS/PRODUCT DEVELOPMENT, ANALYTICAL, AND QUALITY CONTROL
KEYWORDS: BIOASSAYS, BIOSTATISTICS, DATA ANALYSIS, POTENCY, CYTOTOXI#CITY
LEVEL: INTERMEDIATE

Methods
Biology and Data Analysis: Our cell-based bioassay was designed and intended as a potency assay to measure cytotoxic activity of an antibody–drug conjugate on tumor cells. So a dose series of nine concentration points for reference and test material are prepared in a dilution block, then added with tumor cells expressing the target antigen to 96-well plates. Those are then incubated in a 37 °C, 5% CO2 cell culture incubator. At the end of that incubation, plates are equilibrated to room temperature, and CellTiter-Glo reagent (Promega Corporation) is added. After being shaken, plates are read for the raw signal of luminescence using a SpectraMax M5 plate reader and SoftMax Pro software version 5.0.1 from Molecular Devices LLC. A luminescent signal is proportional to the number of metabolically active cells in each plate well, providing a measurement of cell viability.
Our data analysis is based on a typical approach used for many bioassays (9). Briefly, we fit the luminescence signal to concentration points using a nonlinear four-parameter logistic (4PL) model. The raw signal goes through a logarithmic10 transformation, and transformed values for both reference and test materials are fit independently to the 4PL model using an iterative algorithm. D and A are parameters for the lower and upper asymptotes, respectively; B is a slope parameter; and C characterizes the half-maximal effective concentration (EC50).

After assessing the fit using fitted curves for both reference and test materials (known as the unconstrained or unrestricted model), we refit the data using common slope and asymptote parameters (in a constrained or restricted model) such that the only difference in predicted values for reference and test material is the horizontal displacement of the EC50. Parallelism between reference and test materials is determined using the extra sums-of-squares F-test to compare residual sums of squares between the constrained and unconstrained models. If those are deemed parallel, then we calculate the percent relative potency (%RP) as the ratio of EC50 for both reference and test material. For curve-fitting and parallelism evaluation, we used PLA software version 2.0 from Stegmann Systems. USP <1032> and <1034> describe alternative methods of evaluating parallelism and system suitability criteria (1, 3).
Experimental Design of Qualification Study: Objectives of our qualification experiment were
to estimate assay accuracy, intermediate precision, and linearity across the normal operating range of assay conditions
to assess robustness of relative potency and 4PL model parameters to critical assay parameters.
During initial development, we identified five assay parameters (factors) as critical for successful assay performance. Represented by letters A–E, they are cell density (A) and the measured times for four different assay steps: dose series sitting (B), sample assay incubation (C), cooling (D), and plate shaking (E). Figure 1 illustrates the steps of this assay.
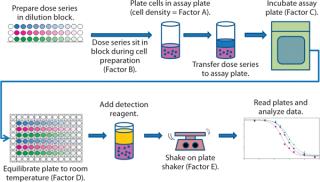
Figure 1: ()
We established low, middle, and high levels for each factor that corresponded to target and proposed ranges in the assay test method. Using the levels of those factors, we then created a 25–2 fractional factorial (10) with eight independently replicated center points using DesignExpert software version 8.0.7.1 from StatEase. We chose the Resolution III design Table 1 shows because the main effects — or mean difference between the high and low levels for each factor — were of primary interest, and we assumed that two-factor interactions were unlikely to occur.
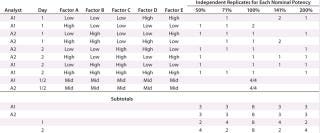
Because outcomes can differ among assay analysts, we divided the 16 experimental runs further into two blocks of eight conditions for each analyst to perform. Eight center points provided sufficient replication to achieve the qualification objectives. Our proposed design called for two analysts running four experimental conditions on each of two days.
For each experimental condition, we prepared the test material at multiple levels of strength to test nominal potencies of 50%, 71%, 100%, 141%, and 200%. Our use of 71% and 141% come from the geometric mean of the bracketing levels as described in USP <1033> (2). In addition to a reference material, we put two test samples on each plate. Alternating placement of different strength potencies on and across plates minimized bias from analysts, assay days, and plates. In all, we used 48 plates to generate 144 curves and 96 potency results, which included 16 independent preparations for the 100% nominal potency and six independent preparations for each of the other nominal potencies (Table 1).
Statistical Methods: Our statistical analyses of assay accuracy, intermediate precision, and linearity followed the methods described in USP <1033> (2). Briefly, because the observed standard deviation increased with the mean, we determined that a log-normal distribution would be most appropriate to describe the %RP. Thus, we performed a logarithmic10 transformation and based all analyses on the transformed values. Geometric mean, percent relative bias, and percent geometric standard deviation (%GSD) were calculated using formulas from USP <1033> (2). We assessed bioassay linearity — sometimes called dilutional linearity — from 50% to 200% by linearly regressing the observed log-transformed %RP against the nominal log-transformed %RP.
We calculated two-sided 90% confidence intervals (CIs) for both the slope and intercept. Initially, the linear model included additional terms that allowed estimation of separate slopes and intercepts for each analyst. To assess accuracy for each nominal potency level, we calculated the percent relative bias and its two-sided 90% confidence interval (significance level of 0.05) and compared it with acceptance criteria of –9.09% to 10%, which is analogous to criteria of ±10% for normally distributed data, as described in USP <1033> (2). Intermediate precision for each potency level came from a random-effects model that included terms to estimate variability from different analysts, assay days, sample preparations, plates, and replicates on the same plate. We assessed robustness of critical assay factors to %RP and 4PL model parameters by estimating mean differences between the high and low levels. P-values for terms from a linear model (including all main effects, estimatable two-factor interactions, and the analyst block effect) determined statistical significance. We assessed the practical significance using interaction and main-effect plots. Our statistical analyses involved DesignExpert software version 8.0.7.1, JMP software version 10.0 from SAS, and the SAS program.
A sample size of 16 independent %RP values for the 100% nominal potency gave us ~80% power to conclude that the percent relative bias was within the ±10% acceptance criteria. That calculation assumed a significance level of 0.05, a true absolute relative bias of ≤4%, and intermediate precision of 10% GSD. This sample size is also adequate for making preliminary estimates of the magnitude of variability from between- and within-run factors. The six replicates of other nominal potencies did not have optimal statistical properties for estimating accuracy or precision, but they represented the largest sample size we could reasonably afford. Six replicates provided a better estimation of linearity than other types of assessments (e.g., 11).
Results
Linearity:Figure 2 shows a linear regression model for observed and nominal log10 %RP across the five nominal potency levels. Regression lines for two analysts are nearly coincident, and further analysis showed no statistical differences between them in the intercept (p = 0.86) or slope (p = 0.59). Because of that lack of differences, we fit a regression model with a single intercept and slope to data from both analysts, and Table 2 lists estimates of those parameters with their two-sided 90% confidence intervals. The slope of the line is 0.99 (90% CI, 0.95–1.02), and the intercept is 0.03 (90% CI, –0.04 to 0.10). Because the confidence interval for the intercept includes 0 and that for the slope includes 1, there is no significant difference from hypothesized values. More important, those confidence intervals provide an assessment of variability around the estimates and enable use of equivalence testing to ensure that the slope and intercept have acceptable scientific merit. For our study, we did not set a priori acceptance criteria, but the confidence intervals fall within a region that we consider to be excellent for bioassay linearity.
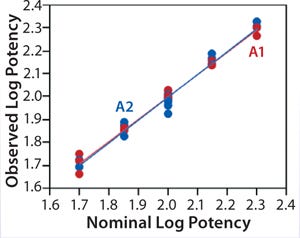
Figure 2:

Accuracy was based on the percent relative bias of each nominal potency level. Figure 3 shows the percent relative bias and two-sided confidence intervals, with estimates listed in Table 3. The figure also shows acceptance criteria as solid horizontal lines. The largest average percent relative bias was 3.1% at the 50% potency level, and we estimated that at 100% with 90% confidence to be within –3.9% and 1.2%. Even with just six independent replicates, the confidence interval fits well within acceptance criteria for all nominal potency levels.
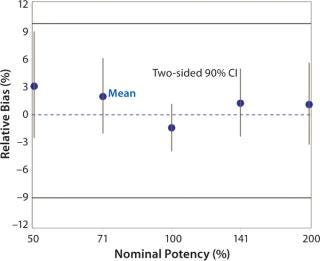
Figure 3: ()

Intermediate Precision:Table 4 lists our estimates of variance components for each level of nominal potency. The overall percent geometric standard deviation (%GSD, intermediate precision) for a nominal potency of 100% was 7.9%, whereas the %GSD from other potency levels ranged from 7.7% to 12.8%. For four of the five nominal potency levels, most variability in %RP came from within-run factors, so we concluded that it could be attributed primarily to sample preparation and positioning on the plate.

Robustness of %RP and 4PL Parameters: We assessed assay robustness based on changes in both %RP and 4PL parameters for critical assay factors evaluated in the fractional factorial and across analysts, plates, and plate positions. None of the main effects or interaction terms in the statistical model for %RP was statistically significant, with p values ranging from 0.12 to 0.79. However, a plot (Figure 4) for the interaction between dose series sitting time and plate shaking time showed an average ~13% increase in %RP when the sitting time was increased from its low to high level and plate shaking was at its high level. Although not statistically significant, the magnitude of that difference was interesting. The interaction is aliased with other two-factor interactions, so its causal factors cannot be definitively determined without additional experiments. To reduce assay time (and to be cautious), we decreased the upper time limit for both the dose series sitting in the dilution block and the plate shaking. The next phase of assay optimization will include future experiments to further elucidate the cause and magnitude of this interaction.
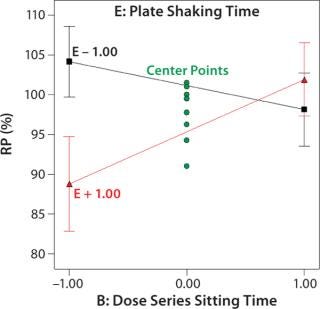
Figure 4: ()
We assessed robustness of the slope and the upper and lower asymptotes to critical assay factors similarly to the %RP robustness assessment described above. No differences were found to be practically important.
In addition to assay factors studied as part of the fractional factorial study, we evaluated for robustness other variables that affect assay performance. For brevity, two figures of interest are included here. Figure 5 demonstrates a modest mean difference in %RP attributed to the analysts, which may warrant close monitoring as part of the assay life cycle. Figure 6 displays a modest increase in %RP for test material placed at the bottom of the plate (position 3) and for material plated chronologically later (plate 2). That finding led us to modify the positioning of the reference material on the plate to minimize position effects, and it points to a subject for more monitoring and optimization.
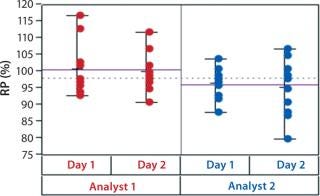
Figure 5: ()
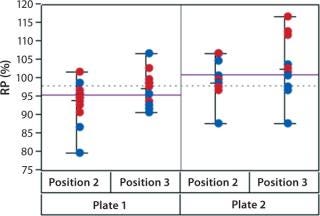
Figure 6: ()
Discussion
Here we have outlined a systematic approach to qualification of an early phase bioassay using DoE. Our approach provided estimates of assay accuracy, intermediate precision, linearity, and robustness — which we tested across a number of normal operating ranges specified in the method. This comprehensive approach offers many benefits.
Benefits: First, data generated across the range for each assay factor provide reportable results for evaluating accuracy, precision, and linearity that should be more representative of routine testing than results from a study in which each experimental run occurs only at target conditions. Although target conditions can be met easily in assay qualification, during routine testing assay factor levels that are critical to performance often vary. They may even be pushed to the limits specified in a test method because of busy schedules and/or multiple priorities. The approach we describe here provides estimates of accuracy and precision under conditions that are expected to be encountered during routine testing. Thus, it provides additional assurance for predicting future assay performance.
Second, at the cost of sacrificing simplicity, using a single experimental design allows many questions to be answered simultaneously and relatively quickly. All outcomes of interest can be analyzed within a unified statistical framework to understand potential effects of critical assay parameters. Combining those experiments into one often reduces sample size from that needed for running separate experiments to test accuracy, precision, linearity, and robustness.
Finally, a more comprehensive and sta
tistically powered study helps analysts make meaningful conclusions and leads to greater insight into the effects of potential assay modifications. In our study, for example, a high degree of statistical confidence in the accuracy and precision for 100% samples and in linearity across the range of nominal potencies (with reasonable estimates of intermediate precision across more extreme nominal potencies) allowed for informed decision-making about the bioassay’s capability to support product specifications, the stability program, and other development decisions based on it. In addition, because we combined our analysis of accuracy with that of robustness, we could not only quickly identify potential position effects, but also estimate their magnitude as well as the consequences of making adjustments.
Ultimately, we modified our plate layout to moderate a potential plate-position effect and reduced the upper range of two critical assay factors to ensure robustness. In addition to the scientific merit of doing so, the confidence generated from our results using this experimental approach is beneficial for management. It helps them estimate future resource needs and timelines at an early stage of development. We believe this approach could be applied more broadly to analytical assays.
Caveats: This innovative experimental design comes with some challenges, however, primarily attributable to the large number of plates, varied conditions, and multiple assay factors that can be difficult to manage for analysts and statisticians alike. Options for minimizing the technical difficulty of executing this study include
tightening the upper range of each critical assay factor to decrease total assay time
increasing the number of days on which experiments are performed
increasing the number of analysts assigned to the study
reducing the total number of plates run on a given day and throughout the study.
Most of our qualification studies using this systematic approach use fewer replicates and plates. We intentionally used a large number of plates for this particular study based on anecdotal reports suggesting a larger expected intermediate precision than what we observed. A dedicated statistician becomes necessary with such complex experimental designs. Although not required for successful execution, a statistical expert can provide additional insights into results that may not be obvious to untrained analysts.
About the Author
Author Details
Todd Coffey, PhD, is principal CMC statistician in the department of process sciences and technical operations; Mike Grevenkamp is a scientist and Annie Wilson is a research associate II, both in process analytics and potency assays; and Mary Hu, PhD, is director of bioassay development and process analytics at Seattle Genetics, 21823 30th Drive SE, Bothell, WA 98021; 1-425-527-4000; [email protected]; www.seattlegenetics.com.
REFERENCES
1.) Chapter <1032> 2012.Design and Development of Biological AssaysUSP 35–NF 30.
2.) Chapter <1033> 2012.Biological Assay ValidationUSP 35–NF 30.
3.) Chapter <1034> 2012.Analysis of Biological AssaysUSP 35–NF 30.
4.) Chen, XC. 2012. Implementation of Design of Experiments (DOE) in the Development and Validation of a Cell-Based Bioassay for the Detection of Anti-Drug Neutralizing Antibodies in Human Serum. J. Immunol. Meth. 376:32-45.
5.) Kutle, L. 2010. Robustness Testing of Live Attenuated Rubella Vaccine Potency Assay Using Fractional Factorial Design of Experiments. Vaccine 28:5497-5502.
6.) Cheng, Z-J. 2012.. Development of a Bioluminescent Cell-Based Bioassay to Measure Fc Receptor Functionality in Antibody-Dependent Cellular Cytotoxicity.
7.) Wei, X. 2007. Development and Validation of a Quantitative Cell-Based Bioassay for Comparing the Pharmacokinetic Profiles of Two Recombinant Erythropoietic Proteins in Serum. J. Pharm. Biomed. Anal. 43:666-676.
8.) Gazzano-Santoro, H. 1999. Validation of a Rat Pheochromocytoma (PC12)-Based Cell Survival Assay for Determining Biological Potency of Recombinant Human Nerve Growth Factor. J. Pharm. Biomed. Anal. 21:945-959.
9.) DeLean, A, PJ Munson, and D Rodbard. 1978. Simultaneous Analysis of Families of Sigmoid Curves: Application to Bioassay, Radioligand Assay, and Physiological Dose-Response Curves. Am. J. Physiol. 235:E97-E102.
10.) Myers, RH, and DC Montgomery. 2002.Two-Level Fractional Factorial DesignsResponse Surface Methodology: Process and Product Optimization Using Designed ExperimentsSecond Edition, John Wiley & Sons, New York:155-202.
11.) Susanj, MW. 2012. A Practical Validation Approach for Virus Titer Testing of Avian Infectious Bursal Disease Live Vaccine According to Current Regulatory Guidelines. Biologicals 40:41-48.
You May Also Like


