Development of a High-Capacity MAb Capture Step Based on Cation-Exchange ChromatographyDevelopment of a High-Capacity MAb Capture Step Based on Cation-Exchange Chromatography
May 1, 2009
Protein A affinity chromatography is traditionally used as the capture step for monoclonal antibodies (MAbs) (1,2,3). It yields high purity because only the fragment-crystallizable (Fc) region of an antibody (IgG1 or IgG2) or Fc-containing fusion protein can bind to the protein A ligand. The resulting specificity provides substantial reduction in impurities such as host cell proteins (HCPs) and DNA (4,5,6,7,8).
The dynamic binding capacity of protein A chromatography resins is generally ≤40 g/L and depends highly on residence time because of the diffusional nature of the binding process. Most commercially available protein A resins can not withstand cleaning at high concentrations of sodium hydroxide except for MAbSelect SuRe brand from GE Healthcare (www.gehealthcare.com), which is chemically modified to tolerate extreme pH conditions (9,10).
PRODUCT FOCUS: ANTIBODIES
PROCESS FOCUS: DOWNSTREAM PROCESSING
WHO SHOULD READ: PROCESS DEVELOPMENT PERSONNEL
KEYWORDS: BINDING CAPA#CITY, CATION-EXCHANGE CHROMATOGRAPHY, PROTEIN A
LEVEL: INTERMEDIATE
Protein A chromatography media are expensive, US$9,000–12,000 per liter. In addition, leached protein A must be removed from final products because the ligand is a potent immunomodulator, and its final levels need to be verified by an ELISA release assay (11,12,13). Finally when protein A chromatography is used in large-scale operations, the media must be stored in 20% v/v ethanol, which requires fire-proof facility designs.
Antibody expression levels have significantly increased to ≥10 g/L in fed-batch cultures thanks to advances in expression vectors, host cell lines, and media development (14). To meet the demands of these increased titers, protein A chromatography columns need to be further scaled up in size and/or run in multiple cycles — with a consequent increase in buffer consumption, preparation, and storage. The biopharmaceutical industry urgently needs a solution to this dilemma.
One way to address this problem is to develop other capture steps with high-capacity resins that can replace the protein A step. In this context, high capacity is understood as a dynamic binding capacity of >50 grams of product per liter of resin. Development of high-capacity purification processes would make it possible to use existing chromatography hardware and eliminate increases in the buffer volume and holding tank size at existing manufacturing plants.
STEFANIE L (WWW.SXC.HU)
Cation-exchange chromatography (CEX) is used as a capture step in several commercial processes including that for Abbott Laboratories’ Humira (adalimumab) antibody, which binds specifically to the inflammatory cytokine TNF-α and was approved for treatment of autoimmune diseases such as rheumatoid arthritis (15,16). Medarex also uses CEX as a capture step in antibody processes that are currently in late-stage clinical trials (17,18,19). And Genentech used a novel factorial screening approach to evaluate the purification performance of a three-step nonaffinity chromatographic process for large-scale antibody purification (20).
Recent developments have led to CEX media with dynamic binding capacities >100 grams of protein per liter of resin, including Capto S brand from GE Healthcare and Toyopearl brand GigaCap S-650M from Tosoh Bioscience (www.tosohbioscience.com) resins (21). Here we describe our development of a high-capacity MAb capture step using CEX chromatography. We tested both resins and focused on the development of the GigaCap S 650-M brand. We demonstrate that it can capture MAbs from clarified harvests with a binding capacity of ≥90 g/L, ≥95% product recovery, and purity comparable to that of protein A including ≥95% HCP reduction.
Materials and Methods
We performed our experiments with an IgG1 antibody expressed in PER.C6 cells from Crucell (www.crucell.com) and produced in 4-L and 50-L working volume stirred-tank vessels. This antibody has an isoelectric point (pI) of 8.1. We used commercially available, chemically defined media for all bioreactor experiments, operating in fed-batch mode. Harvested media were clarified by depth filtration using 10M02 followed by 60ZA05 filters from Cuno (www.cuno.com) followed by sterile filtration using 0.8-µm and 0.2-µm Pall Supor membranes (www.pall.com), then stored at 4 °C for further processing.
We performed small-scale chromatography using 1.0×4.7 cm (3.69 mL) or 1.0×8.1 cm (6.36 mL) columns on an ÄKTA Explorer 100 purification station from GE Healthcare. Intermediate scale-up used a 2.6×14.5 cm (77 mL) column, and large scale-up chromatography used a 5.05×14.3 cm (286 mL) column. We packed columns with GigaCap S-650M resin according to the manufacturer’s instructions. Capto S resin was packed in a 1.6×2.9 cm (5.83 mL) column following manufacturer recommendations.
We equilibrated all columns with a 74 mM sodium acetate buffer of pH 5.3 and conductivity 4.5 mS/cm — except in the loading design of experiment (DOE) study. Bound MAbs were eluted with the equilibration buffer containing 120 mM NaCl, except in the elution DOE study. Eluted MAb was titrated to neutral pH by adding 2 M Tris prior to analysis.
We evaluated purified IgG1 by sodium-dodecyl sulfate polyacrylamide gel electrophoresis (SDS-PAGE) under both reducing and nonreducing conditions using NuPAGE 4–12% Bis-Tris gels from Invitrogen (www.invitrogen.com), by analytical size-exclusion chromatography (SEC) using TSKgel G3000SWXL resin from Tosoh Bioscience, and A280 or analytical Protein-A HPLC for quantitation. We measured HCP levels with an ELISA assay specific for PER.C6 cells. For planning and interpreting DOEs, we used commercial software from Minitab Inc. (www.minitab.com).
Results
We evaluated the binding capacity of both CEX resins using partially purified IgG1 antibody. The dynamic binding capacity of the GigaCap S-650M resin (100 g MAb/L) was higher than that of the Capto S resin (75 g MAb/L) for this antibody under identical chromatography conditions (data not shown). The elution peak was broader for the Capto S resin (>10 column volumes, CVs) than for the GigaCap S-650M resin (~5 CVs). Our results agree with what was reported by Jackewitz (21). So we continued our development work by focusing on the GigaCap S-650M media.
After establishing preliminary loading conditions, we carried out a loading DOE with clarified harvest to define a loading operating window and investigate pH and conductivity.
Six experiments examined three pH values (4.9, 5.2, and 5.5) and two conductivities (4.0 and 5.0 mS/cm). We performed these chromatography runs in a randomized order.
At lower pH and conductivity levels, free light chain (Lc) and HCPs bound more strongly to the resin and reduced the purity of the eluted antibody (Figure 1). At the high end, antibody binding on the CEX resin decreased, so the antibody bound less tightly and started to elute during the wash. Additionally, a lower salt concentration was required for elution. Table 1 summarizes antibody binding capacity at the six different conditions.
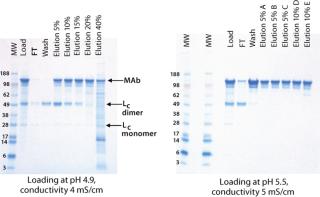
Figure 1: ()
Table 1: Total dynamic binding capacity (grams of antibody per liter of resin) based on analytical Protein A
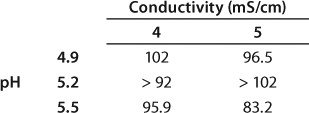
Table 1: To
Figure 2 shows the total amount of HCPs in each fraction for the different runs. At the high end of pH (5.5) and at both conductivities (4 and 5 mS/cm) much more HCPs appeared in the flow-through and wash fractions. Similarly, the total amount of HCPs in the elution fraction was higher at pH 4.9 and both conductivities (Figure 2 insert). All DOE runs had >96% recoveries except for the high end of both pH and conductivity. In this case, the recovery was 85% because of material loss in the flow-through and wash fractions (Table 2).
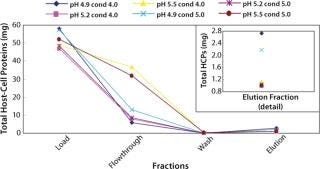
Figure 2: ()
Table 2: Yield, mass balance, and HCP reduction from the loading DOE study

Table 2: Yi eld, mass balance, and HCP reduction from the loading DOE study ()
Based on the binding capacity, product purity (nonreducing SDS-PAGE), recovery, and HCP reduction (ELISA), we determined that the optimal loading conditions were pH 5.2±0.2 and conductivity of 4.5±0.5 mS/cm. So we set the loading conditions for subsequent experiments at pH 5.3 and 4.5 mS/cm conductivity.
Typical production-scale chromatography columns are 15–20 cm packed bed height and operate at a linear flow of ~300–600 cm/h. The scale-down columns we used during development have shorter bed heights and different residence times. We reconciled those differences between production and scale-down columns by examining three relevant residence times and their effects on binding capacity, yield, and product purity (HCP reduction) using the scale-down model. Table 3 shows the process-scale and corresponding scale-down velocities, and Figure 3 depicts chromatograms at the three different residence times. Table 4 shows no significant differences in terms of yield or binding capacity, and we observed a 95% reduction in HCP at each residence time.
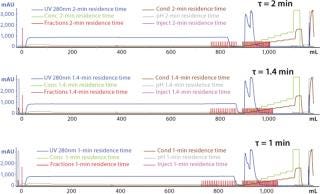
Figure 3: ()
Table 3: Model range of residence times using a small-scale column
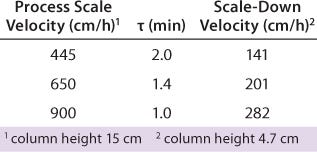
Table 3: Mo
Table 4: Comparing residence time and total binding capacity, yield, and HCP reduction

Table 4: Co mparing residence time and total binding capacity, yield, and HCP reduction ()
We previously established that the antibody elutes off the column with a blend of equilibration buffer and equilibration buffer containing 1 M NaCl (results not shown). The salt concentration in the resulting blend was ~120 mM. We further evaluated the elution conditions by carrying out a DOE study in which we investigated two factors: pH and the NaCl concentration of the elution buffer. We tested three levels for each factor and ran the center point twice for a total of 10 randomized experiments (Table 5).
Table 5: Elution study DOE structure; order of runs is indicated within each box.
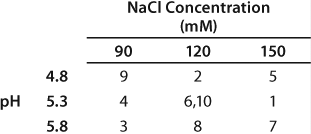
Table 5: El
We observed lower yields at lower pH levels and NaCl concentrations (Figure 4), so we deemed a minimum pH of 5.2 and at least 110 mM NaCl acceptable for eluting this antibody (yield ≥90%). By contrast to the yield profile, maximum HCP clearance was obtained at the lower pH and NaCl concentrations (Figure 5). We determined that to achieve desired purity by the end of our purification process, the HCP impurity level in the capture elution pool needed to be <6.5 µg HCP/mg of MAb. Based on our yield and HCP purity targets, we established an operating window of pH 5.3±0.2 and NaCl concentration of 110±15 mM for this elution step.
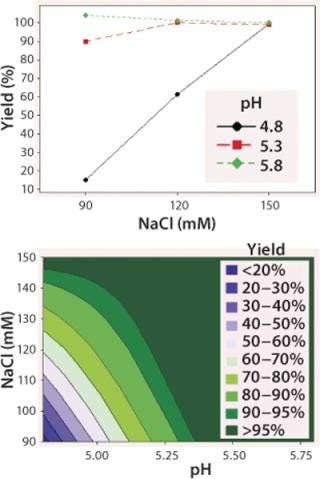
Figure 4: top: Interaction plot for yield of elution DOE
bottom ()
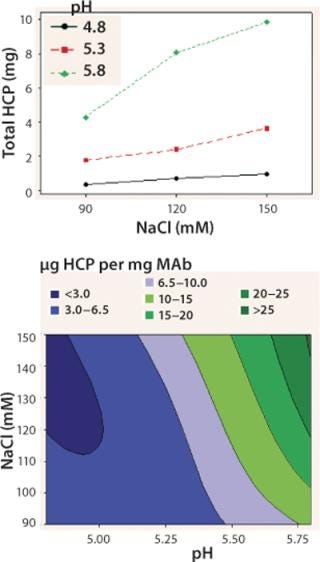
Figure 5: top: Interaction plot for total HCPs in the elution DOE
bottom: ()
We set up a group of experiments to study the effect of load concentration on the CEX binding capacity by examining three feed concentrations: 0.5 mg/mL, 2.6 mg/mL, and 7.7 mg/mL. The targeted load was 450 g of total MAb or 90 g MAb per 1 L resin. Table 6 summarizes the yield, mass balance, dynamic binding capacity, and HCP reduction for each load concentration. At the 7.7 mg/mL load concentration, the resin capacity decreased to 79 g/L; the capacity was unaffected at the two lower concentrations. We found no significant differences in the host cell protein reduction over all three runs (Table 6).
Table 6: Effect of load concentration on the CEX capture step
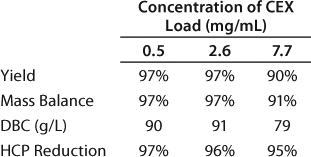
Table 6: Ef
To demonstrate the robustness of the chromatography conditions we developed, we scaled up the column to intermediate and large scale. The intermediate column was 77 mL with 14.5 cm height (representing a 20-fold scale-up), and the large-scale column was 286 mL with 14.3 cm height (80-fold scale-up). The bed height for both represented process-scale conditions. Both columns were loaded to 90–95 g/L resin at pH 5.3 and conductivity 4.5 mS/cm, then eluted in equilibration buffer containing 120 mM NaCl. We cycled the large-scale column three times (Figure 6), obtaining ≥95% yield in all cases. The intermediate scale reduced HCP by 95% (Table 7), whereas the large-scale column reduction was 92%. All three runs at large scale produced nearly identical results. Purity measured by SEC was 99%, and aggregates were ~1%.
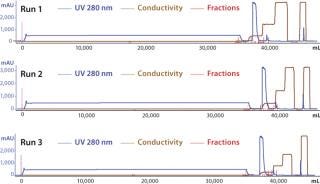
Figure 6: ()
Table 7: Scale-up of the capture step; intermediate chromatography used a 2.6×14.5 cm column; large-scale chromatography used a 5.05×14.3 cm column.

Table 7: Sc ale-up of the capture step; intermediate chromatography used a 2.6×14.5 cm column; large-scale chromatography used a 5.05×14.3 cm column. ()
Discussion and Conclusions
Our goal was to develop a high-capacity capture step for MAbs that could replace traditional protein A affinity chromatography. This new capture step can be used in combination with other established methods for the commercial production of antibodies: anion-exchange membrane or column chromatography, hydrophobic-interaction chromatography, mixed-mode chromatography, hydroxyapatite, and SEC, among others.
A high-capacity capture step is needed to keep up with titer increases without modifying the size of existing chromatography hardware or space dedicated to buffer and holding tanks in existing manufacturing plants. This also alleviates the need to run multiple capture-step cycles. In addition to developing a high-capacity capture step, we demonstrated that CEX will clear impurities such as HCPs and that it has a comparable yield and product purity to protein A affinity chromatography.
We have shown that Toyopearl GigaCap S-650M media can capture a monoclonal IgG1 with ≥90 g/L dynamic binding capacity. This resin can be operated at linear flow rates up to 900 cm/h (over 1 min residence time) without significant loss of capacity. Together with good pressure and flow characteristics, that feature is very relevant because it will directly affect the duration and performance of this capture step (21).
We identified the best loading and elution conditions by executing DOEs. At optimal loading and elution conditions, the recovery of this step is >98%, purity determined by analytical sizing is >98%, and HCP reduction is >95%. These results are comparable to those of an affinity capture step such as protein A.
We demonstrated that this newly developed capture step is readily scalable. At intermediate and large scales, it performed as anticipated in binding capacity, yield, HCP clearance, and purity measured by analytical sizing. Column resin longevity remains to be established. Nevertheless, the cost of this resin is about four- to sixfold lower than that of protein A resins. If the price and capacity of the resin are taken into consideration, that clearly translates to potentially significant cost savings. Although this high-capacity CEX capture step may require more development work per antibody than protein A chromatography, these benefits make a strong case for its implementation in MAb manufacturing.
REFERENCES
1.) Kagel, RA, GV Kagel, and VK Garg. 1989. High Performance Protein A and Immuno-Affinity Chromatography for the Commercial Purification of Anti-Human Tissue Plasminogen Activator. BioChromatogr. 4:246-252.
2.) Godfrey, MAJ. 1993. Assessment of the Suitability of Commercially Available SpA Affinity Solid Phases for the Purification of Murine Monoclonal Antibodies at Process Scale. J. Immunol. Meth. 160:97-105.
3.) Fahrner, RL. 2001. Industrial Purification of Pharmaceutical Antibodies: Development, Operation, and Validation of Chromatography Processes. Biotechnol. Genet. Eng. Rev. 18:301-327.
4.) Ey, PL, SJ Prowse, and CR Jenkin. 1978. Isolation of Pure IgG1, IgG2a and IgG2b Immunoglobulins from Mouse Serum Using Protein A-Sepharose. Immunochem. 15:429-436.
5.) Surolia, A, D Pain, and MI Khan. 1982. Protein A: Nature’s Universal Anti-Antibody. Trends Biochem. Sci. 7:74-76.
6.) Lindmark, R, K Thorén-Tolling, and J Sjöquist. 1983. Binding of Immunoglobulins to Protein A and Immunoglobulin Levels in Mammalian Sera. J. Immunol. Meth. 62:1-13.
7.) Füglistaller, P 1989. Comparison of Immunoglobulin Binding Capacities and Ligand Leakage Using Eight Different Protein A Affinity Chromatography Matrices. J. Immunol. Meth. 124:171-177.
8.) Reis, KJ, MD Boyle, and EM Ayoub. 1984. Identification of Distinct Fc-Receptor Molecules on Streptococci and Staphylococci. J. Clin. Lab. Immunol. 13:75-80.
9.) Hale, G. 1994. Repeated Cleaning of Protein A Affinity Column with Sodium Hydroxide. J. Immunol. Meth. 171:15-21.
10.) Hahn, R. 2006. Comparison of Protein A Affinity Sorbents III: Life Time Study. J. Chromatogr. A 1102:224-231.
11.) Gagnon, P 1996.Purification Tools for Monoclonal Antibodies, Validated Biosystems, Tucson.
12.) Carter-Franklin, JN. 1993. Fragments of Protein A Eluted During Protein A Affinity Chromatography. J. Immunol. Meth. 160:97-105.
13.) Silverman, GJ, CS Goodyear, and DL Siegel. 2005. On the Mechanism of Staphylococcal Protein A Immunomodulation. Transfusion 45:274-280.
14.) Coco-Martin, JM, and MM Harmsen. 2008. A Review of Therapeutic Protein Expression By Mammalian Cells. BioProcess Int. 6:28-33.
15.) Wan, M. 2004.M. Process Mapping: A Necessary Step in Product Lifecycle BioProcess Int. Conf. Exhib., Boston.
16.) Bain, B, and M Brazil. 2003. Adalimumab. Nature Rev. Drug Discov. 2:693-694.
17.) Arunakumari, A, J Wang, and G Ferreira. 2007. Improved Downstream Process Design for Human Monoclonal Antibody Production. BioPharm Int. 20:36-40.
18.) Ferreira, GM. 2007. A Two-Column Process to Purify Antibodies without Protein A. BioPharm Int. 20:32-43.
19.) Wang, J. 2008. Optimizing the Primary Recovery Step in Nonaffinity Purification Schemes for HuMAbs. BioPharm Int. 21:6-10.
20.) Follman, DK, and RL Fahrner. 2004. Factorial Screening of Antibody Purification Processes Using Three Chromatography Steps without Protein A. J. Chromatogr. A 1024:79-85.
21.) Jackewitz, A 2008. Reducing Elution Volumes with High Capacity and Improved Mass Transfer Ion-Exchange Resins. BioProcess Int. 6:108-110.
You May Also Like


