Profitability in the Biosimilars MarketProfitability in the Biosimilars Market
June 1, 2013
The biosimilars space offers significant commercial opportunity. About US$60 billion of branded biologic sales will lose patent protection over the next few years, including some of the largest-selling monoclonal antibodies (MAbs). Companies are jostling among themselves, each seeking the best position to exploit that opportunity. Regulators are creating and refining the necessary pathways to success, alliances are being forged, and companies are being acquired.
Despite the significant opportunity for biosimilar MAbs, significant risks remain. Perhaps the most significant of those is the potential for limited profitability, a concept that has not received sufficient coverage within the biosimilar debate. Biosimilar MAb profitability will be affected by longer-than-anticipated clinical development timelines, higher-than-expected sales and marketing costs, low physician adoption rates, aggressive competition from other biosimilar players, originator company pricing strategies, and originator lifecycle management (LCM) strategies for developing new, related products and formulations.
Recent market experience shows that it will be challenging to successfully develop and commercialize any biosimilar. Although there is no question that money can be made with these types of products, a question does remain regarding just how profitable related investments will turn out to be. Below is an analysis of potential issues facing biosimilar developers in relation to profitability of their investments, along with some thoughts on how the market could evolve.
Background
Much of what has been written and debated on the subject of biosimilars has focused primarily on quality, regulatory, and scientific issues. We have seen extensive analysis of regulatory guidelines, how they affect clinical development strategy, and how they are evolving. Much discussion has also centered on the quality of biosimilars and how modern analytical techniques can effectively characterize them.
Those issues are certainly important, and their debate must continue to ensure that rigorous quality and regulatory standards are maintained. But we have seen very little discussion about the underlying commercial issues facing the sector. Some experts have shared information about biosimilar sales performance in certain markets, but perhaps most critically lacking in the general discussion is a sense of the overarching sustainability of the biosimilars market. How is biosimilar profitability likely to affect that in the future?
My analysis is an effort to provide some insight into the future profitability of this market, with specific emphasis on biosimilar MAbs used in oncology. It is not intended to be exhaustive, but rather a position piece providing a critical view on a market-shaping question: Is there enough money (and, therefore, profit) to be made in biosimilars?
Biotherapeutics are made by living cells with the help of recombinant DNA technology. These products typically fall under one of three categories
products designed to be almost identical to endogenous proteins, thus used as replacement therapies or to augment patients’ own responses (e.g., erythropoietin, somatropin)
MAbs that bind to proteins and block pathways or cells (e.g., trastuzumab, infliximab)
engineered proteins that mimic receptors but are soluble and designed to be stable in vivo (e.g., fusion proteins, such as etanercept and abatacept).
Biologics are also big business. Between 2002 and 2010, global sales of therapeutic proteins and MAbs grew from US$25 billion in 2002 to $117 billion in 2010, representing a compound annual growth rate (CAGR) of 20%. By 2015, Datamonitor expects the value of the global biologics market to reach $145 billion; of that, some $60 billion will be in off-patent branded sales. A key driver of this commercial success has been the cost of treatment. In the United States, biologics cost an average of $45 per day or $16,425 per year, which is more than 20 times the $2 per-day and $730 per-year cost of traditional pharmaceuticals (1).
Biosimilars have been viewed as a potential cost-saving alternative to traditional, originator-developed biologic therapies. Currently a product can be considered to be biosimilar to a reference product if, based on data obtained from comparative nonclinical testing (analytical and animal studies) and clinical studies, the product is shown to be “highly similar” to a reference product. Minor differences in clinically inactive components are permitted as long as they can be justified and providing that no clinically meaningful differences affect safety, efficacy, or quality.
Since the 2005 inception of the biosimilars market, when the European Commission enacted legislation that permitted the European Medicines Agency (EMA) to approve “similar biological therapies,” several biosimilars have been approved around the world. Now 14 approved biosimilars are sold on the European market, including biosimilar versions of somatropin, erythropoietin, and filgrastim. Biosimilar versions of those same products also have been approved in other markets, including Japan, Australia, and Canada (Figure 1). And last year, South Korea approved the world’s first biosimilar MAb, a biosimilar version of Merck & Co.’s Remicade infliximab called Remsima (2).
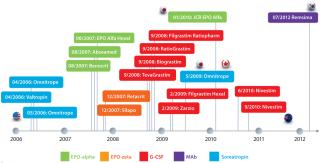
Figure 1: ()
Investment Activity Has Been Robust
Driven by significant opportunity and what is perceived to be a lower-risk strategy for taking a slice of the booming biologics market, some companies have been investing heavily in biosimilars to capitalize on what they see as a great market opportunity. To date, biosimilar business agreements have focused on building synergies and derisking investments (3). Companies have joined forces to maximize the potential of their combined resources or to gain licensed assets or capabilities that fill their own internal gaps. Rarely have they hit the acquisition trail. When they do so, biosimilars are part of the deal rather than the key driver of the transaction.
Investments have been made in technology (e.g., Momenta–Baxter), manufacturing (e.g., Teva–Lonza), clinical research (e.g., Merck–Parexel), and to access pipeline assets (e.g., Merck–Hanwha, Amgen–Watson–Synthon). That is just a small selection of the deals seen in the biosimilars space over the past few years, but it shows that deal flow has been solid (5). As companies jostle for position and strive to establish themselves in this potentially lucrative segment of the biologics ma
rket, much investment has been made.
Is the Bubble About to Burst? Recent events suggest that the “biosimilar bubble” could be about to burst (or at least stop expanding). Several companies that invested heavily in the space have recently hit the pause button on their biosimilar strategies — or changed direction completely.
There are many reasons why. For one, the regulatory situation has become more complex, which in turn raises the potential cost of bringing a biosimilar to market. In addition, defensive LCM strategies that many originator companies have put in place are reducing potential biosimilar opportunities.
In March 2012, Pfizer walked away from a $350 million biosimilar insulin deal with Indian biotech company Biocon, citing competitive issues (4). Although it was not implicitly stated in official communications, many experts believe that Pfizer has pulled away from the biosimilar insulin market due to a belief that selling such products would be an extremely challenging proposition against the current market leaders: Novo Nordisk, Eli Lilly, and Sanofi-Aventis. The company has also invested significantly in biosimilar MAbs, with biosimilar rituximab (PF-PF-05280586) and trastuzumab (PF-05280014) both in phase 1 clinical trials now.
In October 2012, two biosimilar developers announced suspensions of clinical development activities for biosimilar rituximab. First, Teva (which partnered with Lonza on biosimilars) suspended development of TL-011, stating that it was “considering how best to meet the requirements from the US FDA and those necessary for European medical certification” (5). Shortly after Teva’s announcement, Samsung Biologics suspended its development of SAIT101, commenting only that it was “due to some internal reasons” (6).
In December 2012, Merck & Co. made two significant announcements about its biosimilars strategy. First, MBV (the biosimilar division set up in December 2009 with a $1.5 billion investment) was subsumed into the biologics and vaccines division of Merck Research Laboratories because of “reduced expectations” from the market (7). Late last year, Merck announced termination of the $720-million licensing deal with Korea’s Hanwha Chemical that had been focused on developing and commercializing biosimilar etanercept (Amgen’s Enbrel). Reasons for that move are still emerging, but cancellation of the contract was apparently prompted by Merck’s review of its own biosimilars strategy as well as the commercial prospects for biosimilar etanercept given the original product’s patent situation (8).
Commercial Performance Has Been Patchy
On the whole, biosimilar use has varied by class of product and by market. In Europe, a region accounting for about 80% of global biosimilar sales, biosimilar versions of somatropin, erythropoietin, and filgrastim have managed to capture just 11% market share (in volume) for moving annual totals (MATs) between June 2007 and June 2011 (9).
At the market level, some countries have seen high acceptance of biosimilars: Austria, Greece, Sweden, and Germany. The latter, in fact, has some of the highest market shares in Europe based on implementation of regional quotas for some biosimilar prescribing by physicians. Reference pricing and incentive systems encouraging physicians to prescribe biosimilars are also well established in Germany (10). At the other end of the spectrum, biosimilar uptake has been very low in markets such as Italy and Spain, primarily because of relatively little incentive for physicians and patients to use those products.
At the class level, certain biosimilar products are performing well, and others are not. Approval of biosimilar filgrastim in Europe stimulated UK oncologists to review treatment guidance for febrile neutropenia in oncology patients. Oncologists began using biosimilar filgrastim rather than antibiotics as a first-line treatment option, which caused significant volume growth in the market. And treatment outcomes have improved.
Conversely, uptake of biosimilar erythropoietin in the United Kingdom has been poor. Despite being offered at a significant discount from the originator-brand price, biosimilars have managed to capture only 3% of the market by the fourth quarter of 2011. A similar lack of incentive to use the biosimilar version — combined with aggressive originator pricing tactics — have limited the UK market for biosimilar erythropoietin (10).
How will the uptake of a biosimilar MAb compare? It will all depend on market and indication. In Western Europe, for example, access to MAbs for treating cancer is good. So uptake of biosimilars may be low there, with little room for market expansion or improved patient access. But in markets where uptake of expensive oncology drugs has been low historically (e.g., Czech Republic, Hungary, Norway, and Poland), biosimilar MAb uptake could be high. Historically, such markets have been identified as below-average adopters of new drugs for treating breast cancer, colorectal cancer, lung cancer, and non-Hodgkin’s lymphoma (11). Less expensive options, therefore, could improve access and drive market growth.
Implications of Low Uptake: The drivers of biosimilar uptake are manifold. In some markets (e.g., Italy, Spain) payers offer limited incentives for biosimilar use, which allows originator companies to maintain their market share. Originator LCM activity also contributes to slow uptake when originator pricing strategies reduce the attractiveness of biosimilars.
Efficacy questions also could explain the differential uptake of biosimilars for certain indications. Efficacy is not immediate in growth hormone therapy, for example, whereas it can be seen within days with filgrastim therapy. A lack of immediate results may lead some physicians to avoid biosimilars in favor of tried and trusted originator brands.
The issue of low and highly variable uptake also presents a challenge to biosimilar developers in forecasting potential sales and profitability. Although significant off-patent opportunities should arise by 2015 (as mentioned above, estimated at $60 billion globally), using sales performance to date as analogues poses significant risk. Choose the wrong analogue, and you could over- (or under-) estimate sales of your product, which could complicate sourcing and supply chain matters. Make too little product, and you put your ability to meet contractual obligations at risk. Make too much, and you risk a significant dip in profitability as unused product languishes in wholesaler storerooms and on pharmacy shelves.
Biosimilar developers also need to consider a number of other variables that could significantly affect uptake rates and overall profitability. Perhaps the most influential of these is originator LCM strategy. Critical issues that biosimilar developers need to take into account include originator-company pricing strategies and developmental LCM strategies designed to slow down conversion to biosimilars (e.g., reformulation and/or new product strategies).
Potential Influences on Profitability
A biosimilar’s gross revenue and overall profitability are influenced by a broad range of variables, some of which a company can control (e.g., COGs) and others that rely heavily on effective research and development (R&D) and commercialization strategies. After a product is launched, the degree of control that a company has over the variables influencing sales and profitability declines significantly. A biosimilar company can market its product, of course, and provide education to key stakeholders on its benefits while investing in supportive clinical studies to demonstrate long-term safety. But the company has little or no influence on other important issues.
For example, man
y European markets have banned automatic substitution of biosimilars (e.g., Spain, France). There, biosimilar companies will need to invest in extensive sales and marketing activities just to convince key stakeholders to list, prescribe, and reimburse their products. And how companies approach a market can affect their profitability. Those embarking on collaborations and joint ventures are immediately losing profitability to profit-share agreements and royalty-payment schedules.
Perhaps the most critical variable is under originator company control. How much of an impact will originator LCM strategies have on market share? What proportion of a reference biologic’s market will the originator company be able to retain? Will that company be able to switch patients to its own follow-on treatment or reformulation? What if the originator decides to compete on price?
Biosimilar competition is another consideration. How many biosimilar versions of a given product are likely to be launched, and what will be their value propositions? All of those are critical questions that should be asked and answered as accurately as possible at some stage of biosimilar product development.
Assessment of Profitability: A Case Study
To illustrate how some of these variables will affect biosimilar profitability, Datamonitor has developed a scenario-based analysis of an individual biosimilar opportunity associated with a branded biologic: Product X, a MAb in the oncology setting generates global sales of $5 billion annually.
Biosimilars are, by definition, highly similar to an originator’s reference product. So there is little that a biosimilar company can do to differentiate such a product from the originator’s branded version other than offering it at a lower price. So these two scenarios have pricing at their core, for both the originator product and biosimilar version.
A $5-billion opportunity may sound highly attractive if you don’t fully understand the actual size of the prize and overestimate sales forecasts without considering significant impacts on biosimilar profitability. So Datamonitor included market-value erosion assumptions regarding an originator company’s ability to retain market share. Other assumptions involve government-driven, mandatory price discounting (Table 1) and the originator’s patent situation.
The global opportunity may be $5 billion, but this analysis assumes that not all of that will be accessible at once. Different regions have different loss-of-exclusivity dates. You can assume that to happen earlier in Europe and the rest of the world than in the United States. There is no “patent cliff” per se, but rather a staggered slope.
Taking into account the market value erosion that results from those assumptions brings the actual biosimilar opportunity down to ~$1.5 billion, which is 30% of the original $5 billion (Figure 2).

Figure 2: ()
Now consider two potential scenarios and how assumptions within each scenario affect revenues and overall profitability. Both have been kept as simple as possible and focus on key variables mentioned above.
To provide an additional level of granularity, Datamonitor also models differing peak class shares similar to those that already have been experienced by certain biosimilar products in Europe. High, moderate, and low class shares are benchmarked against biosimilar filgrastim, erythropoietin, and somatropin class shares in the United Kingdom, respectively. Below is a summary of each scenario, considering how each market might evolve by 2025.
Scenario 1 — Price Parity (“Close the Gap”): Biosimilar versions of Product X are launched in 2014 (Western Europe and the rest of the world) and in 2018 (United States). During the early years, biosimilars are priced at a 15–30% discount relative to the originator’s reference product (depending on market/region). In response to that activity, however, the originator discounted its price by 10–50% (depending on market/region) to compete — and to satisfy mandatory price cuts in some markets. Similarly to the evolution of biosimilar pricing in Western European markets for the filgrastim and erythropoietin markets, the actual difference in price between these products declined. Figure 3 illustrates that evolution over the course of the analysis.
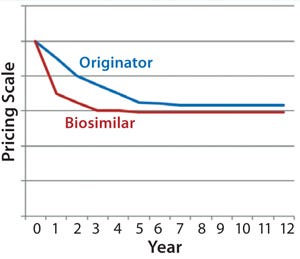
Figure 3:
By 2020, the biosimilar is only about 5–10% less expensive than the originator’s reference product across all markets, where the originator has managed to retain a good market share due to that price-matching strategy. Figure 4 illustrates pretax profit estimations coming from a single company’s first-to-market launch of the biosimilar MAb in this scenario. At each of the three uptake rates used based on a first-market launch in 2014 (in Western Europe) and a subsequent later launch in the United States, peak sales are not reached until 2021.
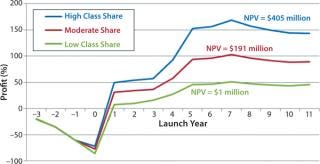
Figure 4: ()
Within this scenario, peak annual pretax profits range between $51 million and $168 million, corresponding to net present value (NPV) estimates of $405 million (high class share), $191 million (moderate class share), and $1 million (low class share). It could be argued that the most likely peak class share that a biosimilar version of Product X could achieve would be similar to the peak class share that biosimilar somatropin has experienced in high-adopting Western European markets. Because the biosimilar product is not sufficiently discounted compared with the reference product, there is little incentive for any key stakeholder group to use it instead. Early gains by the biosimilar when prices are sufficiently different to incentivize its use are balanced out over the course of the analysis as its sales growth slows. Indeed, this price-parity scenario assumes a penetration that could reach something between moderate and low class shares. The ultimate outcome is very low profitability.
Scenario 2 — Price Differential (“Maintain the Gap”): Biosimilar versions of Product X
are launched in 2014 (in Western Europe and the rest of the world) and 2018 (United States). During the early years, biosimilars are priced at a 15–30% discount relative to the originator’s reference product (depending on market/region). In response to that activity and mandatory price cuts in some markets, the originator discounts the price of its product by 10–50% (depending on market/region) to compete and satisfy those mandatory price cuts.
To drive uptake, the biosimilar company discounts the price of its biosimilar version of Product X by up to 50%. That pricing structure is maintained through to 2025, with prices of the biosimilar version maintained at 10% lower in the United States, 30% in Western Europe, and 50% cheaper in the rest of the world. Figure 5 illustrates evolution of originator and biosimilar pricing over the course of this analysis.
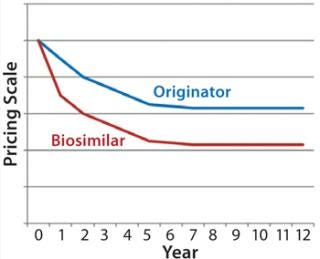
Figure 5: ()
Figure 6 illustrates pretax profit estimations coming from a single company’s first-to-market launch of a biosimilar in this scenario across each of the three uptake rates. Similar to the price-parity scenario — and based on a first market launch in 2014 (in Western Europe) and a subsequent later launch in United States — peak sales are not reached until 2021.
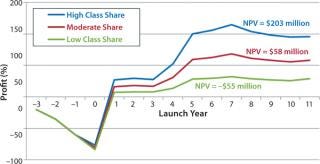
Figure 6: ()
Within this scenario, peak annual pretax profits range from $32 million to $115 million, corresponding to NPV estimates of $203 million (high class share), $58 million (moderate class share) and notably –$55 million (low class share). In this scenario, biosimilars are consistently less expensive than the originator’s brand, so it is safe to assume that they will experience higher use rates. As such, the most likely peak class share that the biosimilar version of Product X could achieve would be somewhere between the experiences with filgrastim (high) and erythropoietin (moderate).
Because the biosimilar product remains at a significant discount, the incentive to use it remains and uptake continues to grow over time. However, by adopting such an aggressive pricing strategy, the biosimilar company is sacrificing profit in favor of volume. In fact, the NPV achieved with a high class share similar to that of biosimilar filgrastim ($203 million) would not be significantly different from that achieved with a lower class share in the price-parity scenario ($191 with moderate uptake). Failing to achieve high market share with an aggressive pricing strategy would put a company at risk due to the sharp decrease in profitability in the moderate- and low-uptake scenarios, with potential NPVs ranging from $58 down to –$55) million, as Figure 5 shows.
Such low profitability per product may be an acceptable risk for a large generics company that can leverage its diverse portfolio to support low-profit assets. But in smaller companies that don’t have large product portfolios and rely on brand-like profitability for their biosimilar assets, aggressive pricing may involve too much risk.
Taking all that into account, the size of the biosimilar opportunity for Product X is far smaller than the $5 billion opportunity originally mentioned. Innovation, switching of patients to other products, mandatory price cuts, the ability of the originator company to retain some market share, and the potential for low peak class shares all contribute to low NPV estimates over the period of analysis (2012–2025). Such low profitability might be viewed as acceptable to some. For most companies, however, both scenarios could be seen as too risky, so investments will probably go elsewhere.
Key Takeaways and Potential Implications
The biosimilars market remains attractive. With about $60 billion worth of off-patent branded opportunity coming down the pipe within the next few years, companies continue to invest heavily and jostle for position in hopes of best positioning themselves to exploit that opportunity. But the “gold-rush” mentality of previous years has given way to a sense of realism. Market performance of biosimilars so far has varied by market and product class. Getting such products to market is one thing; getting them used is a completely different challenge.
To be successful, biosimilar companies need to provide a compelling value proposition for all key stakeholders (including patients, physicians, and payers). A common misconception is that offering a less expensive product will automatically lead to rapid uptake. But experience in Western European markets shows that it does not guarantee uptake, after all. Biosimilar somatropin has been consistently less expensive than branded versions in Europe, but its uptake rates have been far below expectations.
Moreover, some people believe that originator companies will be unwilling to compete on price. In certain markets (e.g., South Korea and Spain), mandatory price cuts give them no choice regarding how their products are priced. However, what if originators continue to compete on price after those mandatory cuts? Will biosimilar companies be able to maintain sufficient discounts relative to the reference products to maintain use? Adopting an aggressive pricing strategy can drive use, but it will also negatively impact profitability.
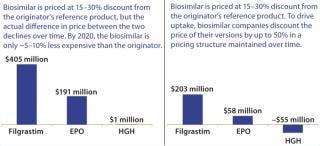
Figure 7: ()
For some companies (mainly generics players), it’s not just about single-product opportunities; it’s more about portfolio expansion and the ability to provided added value to payers. It’s also about potentially better access to products in markets where that has been limited in the past. Ameet Mallik (global head of biopharmaceuticals and oncology injectables at Sandoz Biopharmaceuticals) recently commented in a conference call, “You need to have a number of capabilities and adapt based on different market scenarios. It is hard to justify [significant] infrastructure for a single product. Larger portfolios
would allow a company to leverage economies of scale in development, manufacturing, and commercialization. Seven to 10 [products] will give you a lot of scale, but one or two doesn’t give you much” (12). A low profit on one product thus could be justifiable if it aligns with the overall portfolio’s strategy for sales growth and profitability. For many (smaller) companies, however, a low return on investment will simply not be acceptable — particularly to their shareholders.
Developing and commercializing a biosimilar product is extremely challenging. It’s even more difficult to make a decent return on your investment. Originator companies can, will, and do compete to defend their market share by continuing to innovate and putting different LCM strategies into place. There is money to be made in the biosimilars market. But a key question remains: How much, and is there enough to go around?
About the Author
Author Details
Dr. Duncan A. Emerton is director of Datamonitor Healthcare Consulting, a division of Informa Business Information, 119 Farringdon Road, London EC1R 3DA United Kingdom; 44-20-7551-9156, fax 44-87-0132-4874; www.datamonitorconsulting.com.
REFERENCES
1.) Shapiro, RJ, K Singh, and M Mukim. 2008. The Potential American Market for Generic Biological Treatments and the Associated Cost Savings, Sonecon LLC, Washington.
2.) 2012.World’s First Biosimilar Antibody Is Approved in Korea Biosimilar News.
3.) Emerton, D 2013. Deal-Making in the Biosimilars Market. BioProcess Int. www.bioprocessintl.com/journal/2013/March/Deal-Making-in-the-Biosimilars-Market-340789 11:70-72.
4.) Kulkarni, K, and H Foy. 2012.Pfizer Scraps Insulin Deal with India’s Biocon Reuters.
5.) Gabison, Y 2012.Teva Halts Tests of Cancer Drug Biosimilar Haaretz.
6.) Yoo-chul, K 2012.Samsung Halts Clinical Tests for Biosimilar The Korea Times.
7.) Morrison, C 2012.Merck Says Goodbye to Independent Biosimilars Unit The In Vivo Blog.
8.) Haydock, I 2012.Merck Ends Alliance with Hanwha for Biosimilar Enbrel Scrip Intelligence.
9.) Dunn, C 2012.Biosimilar Accessible Market: Size and Biosimilar Penetration, IMS Health, London.
10.) 2012. European Uptake of Biosimilars, Generic and Biosimilars Initiative: Mol, Belgium.
11.) Wilking, N, and B Jönsson. 2005. A Pan-European Comparison Regarding Patient Access to Cancer Drugs, Karolinska Institutet in collaboration with Stockholm School of Economics, Stockholm.
12.) 2012.Transcript: Novartis AG at Credit Suisse Group AG Healthcare Conference, Thomson StreetEvents, New York.
You May Also Like


