Cell Cultivation Process Transfer and Scale-Up March 2008Cell Cultivation Process Transfer and Scale-Up March 2008
The introduction of therapeutic monoclonal antibodies (MAbs) has greatly revolutionized therapies for several cancer immune disorders (1,2,3,4,5). Benefits to patients have been substantial, translating into both increased life expectancy and improved quality of life. Currently, twenty-one therapeutic MAbs are registered for marketing in the United States, with the introduction of several more expected in the coming years (6,7,8,9,10,11).
PRODUCT FOCUS: MONOCLONAL ANTIBODIES
PROCESS FOCUS: Technology transfer (production) and analytical methods development
WHO SHOULD READ: PRODUCTION AND PROCESS DEVELOPMENT, MANUFACTURING
KEYWORDS: IGF-1R, EXPRESSION, TECH TRANSFER, CELL-LINE CULTIVATION, SIZE-EXCLUSION CHROMATOGRAPHY, ISOELECTRIC FOCUSING, MATRIX-ASSISTED LASER DESORPTION/IONIZATION TIME-OF-FLIGHT MASS SPECTROMETRY, ELECTROSPRAY IONIZATION MASS SPECTROMETRY
LEVEL: INTERMEDIATE
Some cancer cells over-express growth factor receptors on their surface, which when activated signal cell division, proliferation, and survival through integration of multiple downstream pathways (12). Several MAbs used in oncology function by preventing interaction between growth factors and overexpressed receptors located on the surface of malignant cells. This strategy of disabling the most upstream part of these complex signaling pathways through the interference of a MAb with either the intended receptor or its ligand has demonstrated excellent therapeutic benefit to patients (9, 13, 14).
Because overexpression of IGF-1R is prevalent in many cancer types, targeting the insulin-like growth factor 1 receptor (IGF-1R) is an attractive approach to controlling proliferation of cancerous cells. Preclinical evidence strongly supports use of antibody therapy as a potential means of controlling proliferation and survival of malignant cells overexpressing IGF-1R (12, 15,16,17).
With the increasing pace of discoveries, the field of biotechnology is rapidly becoming more complex and fragmented. As a means of leveraging know-how and expertise distributed across two or more institutions, licensing agreements aimed at sharing discovery and development expertise are becoming commonplace both within the pharmaceutical industry and between pharmaceutical and biotechnology companies. Recently, Merck and Co. (MRK) and Pierre Fabre Medicament (PF) entered into an agreement to codevelop an antibody targeting the IGF-1R that was discovered at PF (18,19,20).
Figure 1:
JARED HERZOG (WWW.SXC.HU)
Technology transfers are never a trivial exercise, especially when two distinct companies are implicated. Transfers create the need for careful management of all the activities involved. Time to market can be influenced by early technology transfer steps, and achieving a seamless and rapid transfer of technology is crucial to the eventual success of partnering endeavors.
Development activities in cell cultivation are key to defining reliable, productive, and robust processes. Because of the nature of the cells cultivated, these investigations require extensive investments of resources and time. In many cases, time is most precious because along with securing a “first-to-market” commercial advantage, rapidly reaching key decision points during development of new molecules is critical to achieving greater effectiveness (21). Adding to the pressure on bioprocess development teams is the need to rapidly reach a stage at which sufficient quantities of representative material can be manufactured and used in support of various preclinical and clinical evaluations. These requirements need to be satisfied as process performance and reliability are improved (22). Because MAbs have so far exhibited a relatively high probability of success (7, 8) when compared with small molecules (23), judicious preinvestments that will support program acceleration must be considered during the MAb development cycle.
Here in Part 1, we present activities implemented to achieve an efficient, rapid, and successful process technology transfer from PF to MRK. Part 2 will describe key activities for developing a robust and productive cultivation process that supported production of MAb required for both preclinical and clinical programs. In a period of about nine months, we increased process yield by ∼3.5 fold, scaled-up operation by ∼2,000 fold, and increased MAb production from milligram to kilogram scale.
Materials and Methods: Cell-Line Cultivation, Production
The GS-NS0 cell line (1, 2) used in these studies was obtained from Lonza Biologics (Slough, UK, www.lonza.com) and engineered at the Centre d’ Immunologie Pierre Fabre (Saint Julien, France, www.cipf.com) to secrete a recombinant monoclonal antibody (18).
Cultivation Medium: The cells were routinely cultivated in the commercially available glutamine-free HyQ SFM4MAb medium (HyClone, Logan, UT, www.hyclone.com) supplemented with 2 mL/L of a cholesterol lipid concentrate (Invitrogen, Carlsbad, CA, www.invitrogen.com) and 20 mL/L of a GS nutritive solution (Sigma-Aldrich, St. Louis, MO, www.sigmaaldrich.com).
Cell Banking: A vial was thawed and used to inoculate a 125-mL shake flask containing 25 mL of prewarmed medium. The flask was placed on a shaker operated at 100 rpm in a 5% CO2/95% air incubator maintained at 36.5 °C. After three days of cultivation, the cells were transferred into a 500-mL flask containing 100 mL of cultivation medium. The flask was incubated in the same conditions described above. Two additional successive transfers were performed, first into one 2-L flask and finally into two 2-L flasks, all containing 500 mL of cultivation medium. Once the cells in the final cultivation flask reached a density of about 1 × 10⁶ viable cells (vc)/milliliter, the cells were concentrated by centrifugation, and resuspended in fresh medium to a concentration of 2 × 10⁷ vc/mL. This concentrated cell suspension was subsequently mixed with an equal volume of fresh cultivation medium containing 20% DMSO. The concentrated cell suspension was aliquoted (1 mL) into 2-mL cryovials that were placed in freezing rate–controlled containers (Nalgene, Rochester, NY, www.nalgenunc.com) in a −70 °C freezer for about 18 hours before being transferred to liquid nitrogen tanks (vapor phase at −150 °C).

Figure 2:
Maintenance of Laboratory-Scale Inoculum: One vial was thawed and used to inoculate a 125-mL shake flask containing 25 mL of prewarmed medium. The flask was placed on a shaker operated at 100 rpm in a 5% CO2/95% air incubator maintained at 36.5 °C (Thermo Forma, Marietta, OH, www.medibix.com). After three days of cultivation, the cells were transferred into a 500-mL flask containing 100 mL of cultivation medium. A rolling seed was then maintained in 500-mL flasks by transferring the cells every three to four days into a 500-mL flask containing 100 mL of fresh medium. This rolling seed was maintained for up to 20 transfers (P = 83). Three days before inoculation into the laboratory-scale production vessel, the cells were transferred to 2-L flasks containing 500 mL of fresh medium that were incubated in the same conditions described above. The targeted postinoculation density was about 0.10–0.15 × 10⁶ vc/mL.
Production Process at Shake-Flask Scale: The 500-mL shake flasks (Corning; Corning, NY, www.corning.com/lifesciences) used for routine maintenance and feed development were operated with a 100-mL working volume. During development, cells were inoculated at 1.5 × 10⁵ vc/mL into fresh cultivation medium. The flasks were incubated at 36.5 °C in a 5% CO2/95% air incubator on an orbital shaker (Thermo Forma) operated at 100 rpm. Feed additions were made volume-per-volume determined by the volume of culture at the time of feed.
Production Process in Laboratory Bioreactors: The 3-L stirred tank bioreactors (B. Braun Biotech; Bethlehem, PA, www.sartorius-stedim.com) were operated with a 2-L working volume. Temperature was controlled at a set point of 36.5 °C using an electric heating blanket. The pH was maintained at 7.0 using a cascade of CO2 and sodium bicarbonate (7.5 % solution) additions. During the initial days of the culture, CO2 was required to lower the pH to the desired set point. As cell concentrations increased, and the amount of CO2 and lactate produced by the culture increased, sodium bicarbonate was used to maintain the pH at the desired set point. Dissolved oxygen (DO), measured as percent air saturation at 1 atm pressure, was maintained at 30% of air saturation by intermittent oxygen sparging, constant air flow in the headspace, and constant agitation. The cultures were mixed using dual pitched-blade impellers at a constant set point of 100 rpm. Feed additions were made volume-per-volume determined by the volume of culture at the time of feed.
Production Process in Pilot Bioreactors, Inoculum Development (30-L and 300-L scales): One vial was thawed and used to inoculate a 125-mL shake flask containing 30 mL of prewarmed medium. The flask was placed on a shaker set to 100 rpm in a 5% CO2/95% air incubator maintained at 36.5 °C. After two days of cultivation, the cells were transferred into a fresh 125-mL flask at a cell concentration of 0.15 × 10⁶ vc/mL and a working volume of 30 mL. Three days later, the cells were transferred into a 250-mL shake flask at a concentration of 0.10 × 10⁶ vc/mL and a working volume of 50 mL.
After four days, the cells were used to inoculate two 500-mL shake flasks at 0.15 × 10⁶ vc/mL and 100-mL working volumes. After three days, the cells were used to inoculate two 2-L shake flasks at 0.10 × 10⁶ vc/mL with 500-mL working volumes. After four days, the cells were used to inoculate eight 2-L shake flasks at 0.15 × 10⁶ vc/mL with working volumes of 500 mL.
Three days after the final shake flask stage, the cells were used to inoculate a 30-L seed bioreactor. The 30-L bioreactor was inoculated at 0.15 × 10⁶ vc/mL with a working volume of 24 L. When used as an inoculum source, the 30-L bioreactor was controlled at a pressure of 2.0 psig, temperature of 36.5 °C, pH of 7.0, and dissolved oxygen of 30% saturation. The cells were maintained in the 30-L bioreactor for four days before transferring to the 300-L production bioreactor.
Production Process in Pilot Bioreactors, Inoculum Development (2,000-L scale): Two vials were thawed and each was used to inoculate a 125-mL shake flask containing 50 mL of prewarmed medium. The flasks were placed on a shaker set to 100 rpm in a 5% CO2/95% air incubator maintained at 36.5 °C. After four days of cultivation, the cells of both flasks were transferred into a 500-mL flask at a cell concentration of 0.2 × 10⁶ vc/mL and working volume of 200 mL. Three more days later, the cells were transferred into a 1-L shake flask at a cell concentration of 0.15 × 10⁶ vc/mL and a working volume of 400-mL. After another four days, the cells were used to inoculate two 3-L shake flasks at 0.2 × 10⁶ vc/mL and 1,100 mL working volumes. After three days, the cells were used to inoculate a 36-L spinner flask at 0.15 × 10⁶ vc/mL with an 11-L working volume.
After four days, the cells were used to inoculate two 36-L spinner flasks at 0.2 × 10⁶ vc/mL with working volumes of 22 L. The culture in 36-L spinner flasks (Corning) was mixed at 65 rpm in a 36.5 °C room and sparged with a 5% CO2/95% air mixture at a flow rate of 0.75 slm (standard liters per minute). Three days after inoculation of the final spinner flask stage, the cells were used to inoculate the 300-L seed bioreactor. That bioreactor (ABEC, Bethlehem, PA, www.abec.com) was inoculated at 0.15 × 10⁶ vc/mL with a working volume of 240 L. The bioreactor was controlled at a pressure of 2.0 psig, temperature of 36.5 °C, pH of 7.0, and dissolved oxygen of 30% of air saturation. The cells were maintained in the 300-L bioreactor for four days before transfer to the 2,000-L production bioreactor.
Bioreactor Operation: The 30-L, 300-L, and 2,000-L stirred tank bioreactors (ABEC) were operated with nominal 24-L, 240-L, and 1,600-L working volumes, respectively. Temperature was controlled at 36.5 °C using a steam jacket, and pH was controlled at 7.0 by a cascade of CO2 and sodium bicarbonate additions as described above. DO was maintained at 30% of air saturation by intermittent air or oxygen sparging and constant agitation. Nitrogen sparging was initially used to maintain the DO below 45% of air saturation before inoculation. Constant air flow was maintained in the headspace to maintain a positive pressure.
After inoculation, intermittent air sparging was used to control the DO for the first three days of cultivation. After those three days, oxygen was used in place of air to maintain DO. The culture in the 30-L bioreactor was mixed using a pitched-blade impeller at a constant set point of 80 rpm. In the 300-L and 2,000-L bioreactors the culture was mixed using dual pitched-blade impellers operated at a constant set point of 40 rpm and 20 rpm, respectively. Feed additions were made volume-per-volume determined by the initial volume of culture (sampling and evaporation were considered negligible at this scale). Figure 1A and 1B present an overview of the process operated at the 300-L and the 2,000-L scale, respectively.
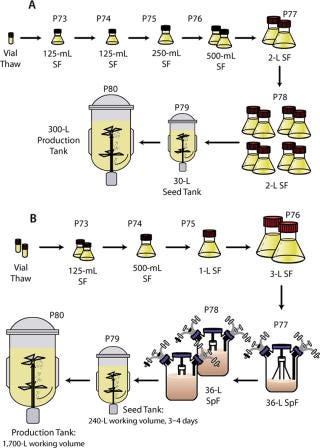
Figure 1: ()
In-Process Assays
Cell Purity Evaluations: Samples obtained from cultures were centrifuged at low speed (50g) for five min in a tabletop centrifuge model 5810R (Eppendorf, Hamburg Germany, www.eppendorf.com) to remove large mammalian cells only. An amount of 0.5 mL of the supernatant was used to inoculate tubes containing 10 mL of the following microbial cultivation media: nutrient broth, thioglycolate broth, brain heart infusion broth, and Sabouraud-dextrose broth. Tubes of each medium were incubated at 27 °C and 37 °C. Tubes that remained clear after 14 days of incubation indicated absence of microbial contamination, except for mycoplasma. Absence of mycoplasma was confirmed at Bioreliance (Rockville, MD, www.bioreliance.com), using a PCR-based detection method.
Measurement of Environmental Parameters: Dissolved CO2, pH, and dissolved O2 were measured off-line using a blood gas analyzer model ABL5 (Radiometer Medical A/S, Denmark, www.radiometer.dk) immediately following daily sample collection. The cells in the remaining sample were removed by centrifugation for 10 min at 200g in a tabletop centrifuge. Glucose and lactate concentrations in the resulting supernatant were determined using a NOVA Bioprofile Analyzer 100 (Waltham, MA, www.novabiomedical.com).
Measurement of Product Concentration: Assays for quantification of recombinant antibody production were performed on supernatant samples prepared as described above using an HPLC fitted with an affinity chromatography column that was operated as previously described (24).
Measurement of Cell Concentration: Viable cell concentrations were determined by the trypan blue exclusion method (25) using a Cedex AS20 (Innovatis, Frazer PA, www.innovatis.com) automated image analysis system (26).
Analytical Methods
Sodium dodecyl sulfate-polyacrylamide gel electrophoresis (SDS-PAGE) was performed with reduced (beta-mercapto-ethanol) and nonreduced samples of antibodies on 12% homogeneous Novex minigels (Invitrogen, Cergy Pontoise, France, www.invitrogen.com). The gels were loaded with 5 µg of each antibody and stained with Coomassie blue.
Size-Exclusion Chromatography (SEC): Native MAbs were analyzed by SEC on a TSK gel G4000SWXL, 7.8 × 300 mm (Tosoh Bioscience, VWR, Fontenay-sous-Bois, France, www.interchim.com) using a Waters HPLC system (Waters, Saint-Quentin-en-Yvelines, France, www.waters.com) consisting of two 510 pumps, a 717 autoinjector, and a 490 UV detector. The mobile phase was phosphate-buffered saline (PBS Dulbeco, Polylabo, Strasbourg, France, www.polylabo.com). The flow rate was 0.5 mL/min and the elution isocratic. The column temperature was ambient and the elution monitored at 210 and 280 nm.
Isoelectric Focusing (IEF): Samples were analyzed by IEF on Pharmacia Phastsystem (Amersham, Orsay, France, www.amersham.com). The minigels’ rehydration buffer was performed with urea 8.68 M, added with Sorbitol 10% (m/V) and triton X100 0.2% (V/V). After sonication, ampholytes (7,8,9) (Bio-Rad, Ivry-sur-Seine, France, www.biorad.com) were added on the basis of 0.4 mL for 5 mL. Spots were deposed at 1 µg for 4 µL. Standards of pI 5–10.5 (Amersham) were used, and Coomassie blue was used for staining.
Isoelectric Focusing Chromatography (C-IEX): The different isoforms of the MAbs were separated on a Dionex WCX-10 cation-exchange column, 4 × 250 mm with a WCX-10 guard column 4 × 50 mm (Dionex, Voisin-Le-Bretonneux, France, www.dionex.com) on a Waters HPLC system. Buffer A was prepared with 10 mM phosphate, pH 7.0 and buffer B with 10 mM phosphate and 1 M NaCl, pH 7.0. The flow rate was 1 mL/min. The amount of injected IgG was approximately 20 µg. The gradient for elution started with 96% solvent A for four minutes, then 4% solvent B followed by a linear gradient of 4–15% solvent B for 30 minutes. After elution, the column was washed with 75% solvent B for nine min and equilibrated with 96% solvent A for 25 min. Elution was monitored at 210 and 280 nm.
Preparation of Reduced and Alkylated Heavy and Light Chains: Samples of MAbs in PBS buffer (1–2 mg/mL) were lyophilized, then solubilized in Tris-HCl 100 mM, 2 mM EDTA, guanidine HCl 6 M, and pH 8.0 buffer to a final concentration of 1 mg/mL. Disulfide reduction was performed by incubating IgG solution with 10 mM DTT for one hour at 37 °C. Iodoacetamide was then added to a final concentration of 60 mM, and the reaction was allowed to proceed for one hour at room temperature in the dark. The chains were separated on a TSK G3000SW size-exclusion column 7.8 × 300 mm (Tosoh Bioscience) using a Waters HPLC system. The mobile phase was 3.0 M guanidine hydrochloride in 50 mM sodium phosphate. The flow rate was 1 mL/min, and the elution was isocratic. The column temperature was ambient and the elution was monitored at 210 and 280 nm. Fractions containing light and heavy chains were concentrated on Amicon Ultra centrifugal filter units (www.amicon.com) The nominal molecular weight cut-off was 10 kDa for light chains and 30 kDa for heavy chains (Millipore, Saint-Quentin-en-Yvelines, France, www.millipore.com) and washed three times with 10% acetic acid.
Matrix-Assisted Laser Desorption/Ionization Time-of-Flight Mass Spectrometry (MALDI-TOF-MS): Samples of MAbs were concentrated and desalted on Microcon YM-30000 MXCO (Millipore) with a sixfold volume of 10% acetic acid. Calculated masses were obtained with MassLynx Biolynx software (Waters). Molecular mass was determined on a Bruker (Bremen, Germany, www.bruker.com) Biflex MALDI-TOF mass spectrometer. Spectra were externally calibrated either with triple charged peaks at m/z 66 431, 33 216 and 22 144 of a BSA solution (25 pmol/µL), respectively.
Electrospray Ionization Mass Spectrometry (ESI-MS): ESI-MS spectra were obtained on an LCT electrospray-time-of-flight (TOF) mass spectrometer (Micromass, Manchester, UK, www.waters.com) equipped with a Z-spray ionization source and with a mass range of 2– 45,000. Samples were dissolved in aqueous 50% acetonitrile containing 1% formic acid at a final concentration of 2–10 pmol/µL. Aliquots (10 µL) were introduced into the ion-source at 6 µL/min flow rate. The extraction cone voltage was usually set to 40 V and the source temperature to 80 °C. Data were acquired in the positive ionization mode. Calibration was performed in the positive ionization mode using the multiply charged ions produced by a separate injection of horse heart myoglobin at a concentration of 2 pmol/µL (Sigma, Saint-Quentin-Fallavier, France). The MaxEnt algorithm (Waters) used the method of maximum entropy to produce true molecular mass spectra from multiply charged electrospray spectra.
Results
Process Technology Transfer: The initial operations pe
rformed in this technology transfer focused on securing a reliable and ample source of cells to support future process development activities to ensure process replication at the new site of implementation.
Cell Banking: Using a quarantine laboratory, the received frozen cells (P58) were thawed and expanded through five passages (∼15 generations) before being cryopreserved as the primary cell bank (P63). Cryopreserved cells from this newly created primary cell bank were thawed and similarly expanded through five passages before being cryopreserved as the working cell bank (P68). Each cell bank produced was made up of approximately 100 cryovials. To ensure quality of the two cell banks generated, standard detection tests and PCR technology verified the absence of adventitious microbes, including mycoplasma. Viability of the cells upon thaw from the primary cell bank and from the working cell bank was measured at 93% and 95%, respectively. Figure 2 summarizes these steps and their associated key data. Based on those data, both cell banks were deemed appropriate for use in future development activities and to serve as sources to create cell banks for production of nonclinical (P72) and clinical material (P72) using a similar expansion approach.
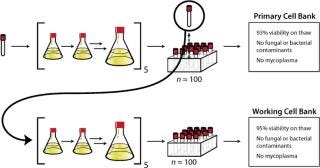
Figure 2: ()
Process Equivalency: Replication of process performance at the new location was evaluated using cells from the newly created working cell bank (P68). The cells were expanded and used to inoculate a 3-L bioreactor as described in the Materials and Methods section. Data presented in Table 1 show that a peak cell density of about 1.8 × 10⁶ viable cells/mL was reached after five days of cultivation. After day five, cell viability gradually decreased to reach 63% viability at day seven. A final antibody concentration of about 100 mg/L was achieved after seven days of cultivation.
Table 1: Summary of process performance and analytical comparability between antibodies produced at two manufacturing locations
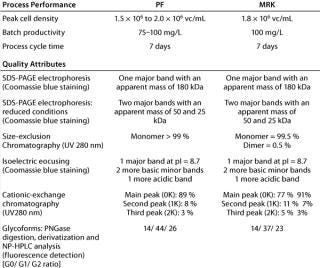
Table 1: Su mmary of process performance and analytical comparability between antibodies produced at two manufacturing locations ()
The data presented in Table 1 show that cell density and the level of MAb production were both very close to those achieved at the site of origin. Once purified, the MAb was analyzed at both the site of origin and at the site of reception. It compared well with reference material applying similar analytical techniques based on shared standard operating procedures (Table 1).
When considered together, these data demonstrate that an efficient and effective transfer of material and process know-how was successfully accomplished within approximately four weeks.
Initial Scale-Up
Rapid delivery of substantial amounts of material is a critical step for most research programs entering early development. Such material supplies support efforts in many areas such as purification process, analytical, and formulation development and investigations on the efficacy and mode of action of a drug candidate. Once process comparability was established, the next step we rapidly implemented was the scale-up of this initial process. However, before scale-up, the impact of a slight modification to the original process was evaluated and deemed acceptable: the elimination of an inoculum centrifugation step performed at the time of inoculation of the production stage bioreactor. The cultivation process was then rapidly scaled up from the 3–L to the 30–L and ultimately to the 300–L scale.
Data presented in Figure 3A and Table 2 show that the growth rate and the peak cell densities achieved across the three scales were very similar. Panel B of Figure 3 and Table 2 clearly show that MAb production was very consistent across scales, both in terms of kinetics, maximum production, and specific secretion rate (Qp). Additional data presented in Figure 3C show that no differences in the glucose consumption and lactate production kinetics were noticeable between the various scales. Finally, cell viability across the three scales exhibited a similar behavior, although a slightly faster decrease in viability was observed at the 3–L scale (Figure 3D). Overall the consistency of the data presented here demonstrates that good scale-up of the original batch process was rapidly achieved. Noticeably, cultivation at the 300–L scale was crucial because it supported production of about 30 g of crude MAb, an amount more than adequate to supply all initially planned development studies.
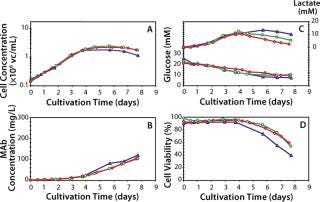
Figure 3: ()
Table 2: Batch process performance at various laboratory scales

Table 2: Ba tch process performance at various laboratory scales ()
Next Issue: Part 2
In parallel to scaling up the batch process described above, a fed-batch process was rapidly developed. Part 2 will detail the subsequent process of fed-batch process development, demonstrate that process at laboratory scale, and describe process industrialization at the pilot scale.
REFERENCES
1.) Andreakos, E, P Taylor, and M. Feldmann. 2002. Monoclonal Antibodies in Immune and Inflammatory Diseases. Current Opin. Biotechnol. 13
:615-620.
2.) Trikha, M, L Yan, and M. Nakada. 2002. Monoclonal Antibodies As Therapeutics in Oncology. Curr. Opin. Biotechnol. 13:609-614.
3.) Strategic Report 2004.Monoclonal Antibody Therapies 2004: Entering a New Era, Arrowhead Publishers, Minnetonka.
4.) Hinoda, Y. 2004. Monoclonal Antibodies As Effective Therapeutic Agents for Solid Tumors. Cancer Sci. 95:621-625.
5.) Pangalis, G. 2006. Immunotherapeutic and Immunoregulatory Drugs in Haematologic Malignancies. Curr. Top. Med. Chem. 6:1657-1686.
6.) US Food and Drug Administration Therapeutic Biological Products.
7.) Reichert, J, and A. Pavlou. 2004. Monoclonal Antibody Market. Nature Reviews 3:383-384.
8.) Reichert, J. 2005. Monoclonal Antibody Successes in the Clinic. Nat. Biotechnol. 23:1073-1078.
9.) Saltz, L, C Easley, and P. Kirkpatrick. 2006. Panitumumab. Nat. Rev. Drug Discov. 5:987-988.
10.) Narayanan, R. 2006. Ranibizumab. Nat. Rev. Drug Discov. 5:815-816.
11.) Parker, C, S Kar, and P. Kirkpatrick. 2007. Eculizumab. Nat. Rev. Drug Discov. 6:515-516.
12.) Laviola, L, A Natalicchio, and F. Giorgino. 2007. The IGF–1 Signaling Pathway. Curr. Pharm. Des. 3:663-669.
13.) Ellis, L, and P. Kirkpatrick. 2005. Bevacizumab. Nat. Rev. Drug Discov.:S8-S9.
14.) Goldberg, R, and P. Kirkpatrick. 2005. Cetuximab. Nat. Rev. Drug Discov.:S1-S11.
15.) Pollak, M, E Schernhammer, and S. Hankinson. 2004. Insulin-like Growth Factors and Neoplasia. Nat. Rev. Cancer 4:505-518.
16.) Baserga, R. 2005. The Insulin-Like Growth Factor-1 Receptor As a Target for Cancer Therapy. Expert. Opin. Ther. Targets 9:753-768.
17.) Hofmann, F, and C. Garcia-Echeverria. 2005. Blocking the Insulin-Like Growth Factor-1 Receptor As a Strategy for Targeting Cancer. Drug Discov. Today 10:1041-1047.
18.) Goetsch, L. 2005. A Recombinant Humanized Anti-Insulin-Like Growth Factor Receptor Type 1 Antibody (h7C10) Enhances the Antitumor Activity of Vinorelbine and Anti-Epidermal Growth Factor Receptor Therapy Against Human Cancer Xenografts. Int. J. Cancer 113:316-328.
19.) Beck, A. 2007. Peptides As Tools for Immunotherapies. J. Pept. Sci. 13:588-602.
20.) Pandini, G. 2007. Functional Responses and In Vivo Anti-Tumor Activity of H7c10, a Humanized Monoclonal Antibody with Neutralising Activity Against the Insulin-Like Receptor Growth Factor-1 (IGF-1) Receptor and Insulin/IGF-1 Hybrid Receptors. Eur. J. Cancer 43:1318-1327.
21.) Pisano, G. 1997.The Development Factory: Unlocking the Potential of Process Innovation, Harvard Business School Press, Boston.
22.) Carroll, S, and M. Al-Rubeai. 2004. The Selection of High-Producing Cell Lines Using Flow Cytometry and Cell Sorting. Expert Opin Biol Ther. 4:1821-1929.
23.) Kola, I, and J. Landis. 2004. Can the Pharmaceutical Industry Reduce Attrition Rates?. Nat. Rev. Drug Discov. 3:711-715.
24.) Fries 2,, and J. Zhang. 2003.. Development of a Shake-Flask Model for the Evaluation of Animal Protein-Free Media for Adenovirus Production in Per.C6 Cells.
25.) Tennant, J. 1964. Evaluation of Trypan Blue Technique for Determination of Cell Viability. Transplantation 2:685-694.
26.) Gudermann, F Moreira, J.. 1997.CeDEX: Automated Cell Density Determination. Animal Cell Technology, Kluwer Academic Publishers, Boston:301-305.
You May Also Like


