Applying Intelligent Flow Microscopy to BiotechnologyApplying Intelligent Flow Microscopy to Biotechnology
Ongoing requirements for additional insight and CGMP-compliant measurement have led to interest in new technologies that can be applied to the analysis of many different types of particle-containing fluids. Micro-Flow imaging (MFI) is a robust, versatile, and intelligent vision technology that is increasingly used for evaluating populations of microparticles encountered during bioformulation development (1). It is also being accepted in fill–finish processes and many other biotechnology applications.
Features of MFI technology that have contributed to its rising popularity include the direct insight provided by imaging, a superior sensitivity for near-transparent particles, ease of use, and flexibility in resolving and independently analyzing different particle types present in heterogeneous populations. For example, the technology is used to quantify transparent protein aggregates of various morphologies that can coexist with silicone droplets, air bubbles, micelles, and a variety of foreign contaminants. The MFI technique can be used to detect, evaluate, classify, and independently enumerate the different particle types present.
PRODUCT FOCUS: ALL BIOLOGICS
PROCESS FOCUS: DEVELOPMENT
WHO SHOULD READ: QA/QC, PRODUCT/PROCESS DEVELOPMENT, ANALYTICAL/FORMULATIONS
KEYWORDS: PARTICLE ANALYSIS, ANALYTICAL METHOD DEVELOPMENT, CELL COUNTING, AND MICROFLOW IMAGING
LEVEL: INTERMEDIATE
Flow Microscopy
The purpose of MFI technology is to extract a rich data set of parameters from individual members of a large particle population and then use those parameters to isolate subpopulations of interest within a heterogeneous sample. Figure 1 shows the instrument configuration. Bright-field images are captured in successive frames as a continuous sample stream passes through a flow cell positioned in the field of view of a custom magnification system with a well-characterized and extended depth-of-field. A focusing routine that directly measures or is traceable to measurements on a reference bead population ensures consistent flow-cell placement. Each image containing many particles is analyzed in real-time by the system software. Sensitivity is maximized for detecting near-transparent particles and verified against a sensitivity standard.
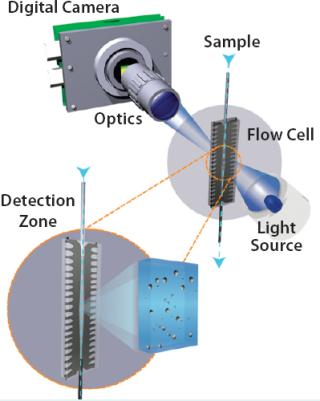
Figure 1: ()
MFI images are analyzed to compile a database containing particle count, size, and concentration information with a range of shape and image contrast parameters. This database is interrogated by the system application software to produce parameter distributions using histograms and scatter plots. The software supports particle parameter filtering by generating filters based on user-selected images representative of the particle population of interest. Users can then optimize the filter(s) to extract similar particles from the total population.
That feature allows particle subpopulations to be isolated and independently analyzed. Particle images are then made available for verification, further investigation, and analysis. Successful protocols can be added to an inventory of standard operating protocols for future use. Success with a particular assay depends on whether the resulting data can be mined for the particular information of interest.
To be distinguishable by the system software, subpopulation particle parameters must possess sufficiently distinct morphology. The degree if distinction depends on specific particle attributes, the overall particle population in a sample, and the particular instrument configuration. If a satisfactory filter cannot be found for a given sample, the unique morphology signature of a particle subpopulation may be emphasized by choosing a different hardware configuration or by modifying the original sample preparation protocol. Instrument operation is straightforward, and no user calibration is required.
A standard benchtop configuration uses a simple fluidics system with each sample drawn directly from a pipette tip or larger container through the flow cell using a peristaltic pump. Concentration and size measurements are absolute and may be reverified using particle standards. Typical sample volumes range from about 0.25 mL to tens of milliliters.
Images displayed during operation provide immediate visual feedback on the nature of a given particle population. Qualification studies for pharmaceutical applications have shown that MFI technology can meet high standards for sizing and concentration accuracy, repeatability, and sensitivity for near-transparent particles (2). Table 1 shows representative performance parameters for instrument configurations used in formulation development applications.
Table 1: Typical MFI performance parameters
Current Applications in Formulation, Fill and Finish
Formulation Development: Protein pharmaceuticals are susceptible to formation of subvisible and visible aggregates. Because such aggregates can deplete the active pharmaceutical ingrediate and be allergenic (3), it is desirable to minimize their formation during processing and packaging. Formation factors include aging, elevated temperatures, freeze–thaw, agitation, high-shear flow, and exposure to foreign materials. MFI technology is used in formulation development because of its high sensitivity for detecting and imaging transparent particles and its unique ability to accurately analyze protein particles in heterogenous particle populations. Figure 2 shows representative MFI images of protein aggregates.
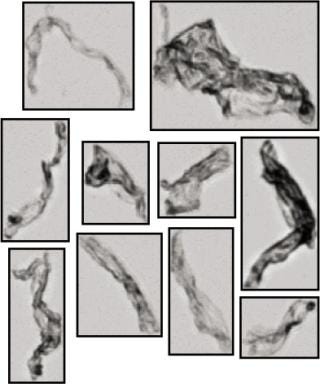
Figure 2: ()
The results shown in Figures 3 and 4 were collected from a model protein formulation containing a mixed population of protein aggregates and silicone oil microdroplets. Although both particle types are highly transparent, MFI technology can detect each and differentiate between them using shape analysis. A comparison of visual- and software-selected images showed that a simple aspect ratio filter ≥0.85 and equivalent circular diameter (ECD) ≥5 µm provided a filter isolation accuracy of 96% (4% of particles were mislabeled). Use of additional filter parameters would further increase that accuracy.
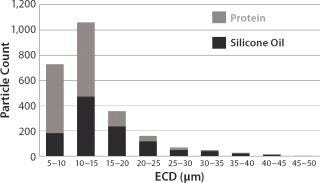
Figure 3: ()
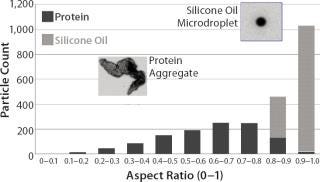
Figure 4: ()
Fill–Finish Operations: International pharmacopoeias (USP, JP, and EP) prescribe limits and enumeration methods for subvisible (≥10-µm and ≥25-µm diameter) particulate matter in parenteral products. But protein-based pharmaceuticals may contain sizable populations of aggregated proteins and other particulates such as silicone oil microdroplets, micelles, and air bubbles in the subvisible size range. The physical and optical properties of those particulates present challenges to the prescribed methods in achieving reliable detection and sizing. Because such test methods do not differentiate particle types, intrinsic particles such as protein aggregates and air bubbles can be incorrectly diagnosed as foreign contamination.
MFI analysis complements the prescribed methods by allowing protein aggregates or other intrinsic particles to be excluded from the total particle count, thus providing a more accurate representation of the actual foreign particle population in a sample. MFI images also provide information on particle morphology that can be used to help determine the origin of contaminants and intrinsic particle populations (4).
Other Biotechnology Applications
In addition to protein particle and fill-finish applications, MFI technology is being used in a diverse range of biopharmaceutical applications. Some include analytical and purification methods development, materials analysis, drug delivery development, and cell culture analysis.
Immunoassay, Chromatography, Cell Culture Bead Analysis: MFI technology is being used to evaluate uniformity and circularity of coated microbeads and to identify fines, fractured beads, and other sources of contamination.
Biopharmaceutical Containers: MFI technology is being used to evaluate materials and application processes with respect to the shedding of lubricants (principally silicone oil) used on pharmaceutical syringes and vial stoppers. Because lubricant microdroplets are suspected of promoting aggregation in protein pharmaceuticals, container manufacturers are using MFI technology to characterize and control that phenomenon.
Dispensing Devices: MFI technology is being used to detect and measure very small concentrations of particles (<5/mL) in characterizing stress-related aggregation or shedding from components in point-of-use injection devices including pumps and syringe filters.
Drug Delivery Vehicles: MFI technology is being used to measure size and shape distributions of drug delivery vehicles such as alum particles and lipid microspheres.
Cell Rupturing and Aging: MFI technology is being used in fluid analysis directed at achieving a balance between incomplete rupturing of cell populations and excess stress resulting in protein damage. The method is also used to measure subtle changes in cell size and shape in population stability studies of red blood cells.
Buffers and Carrier Fluids: Many types of non–cell-containing fluids are encountered in biotechnology for which MFI analysis could be of value. An example is the detection and analysis of undesired microparticles (such as aggregates) during purification process development and protein separation. When microfiltration is used, removal is complicated by the tendency for particles greater than the pore size to appear downstream of a filter. Analysis of particulate populations during purification and separation could contribute both to chemistry optimization and filter system design. In performing such tasks, MFI technology offers higher sensitivity than indirect techniques such as turbidity or light obscuration and provides the additional insights of particle visualization, shape analysis, and image filtering.
Figure 5 shows pre- and postfiltration (0.22-µm filter) size distribution measurements for a model monoclonal antibody (MAb) formulation in which a high concentration of aggregates had been induced by agitation. Postfiltration results obtained using a light-obscuration particle counter are included for comparison. The single filtration step is seen to substantially reduce but not eliminate the presence of large aggregate particles. The concentration of particles detected by MFI technology and confirmed by visual inspection of their images is substantially higher than the results from the obscuration instrument.
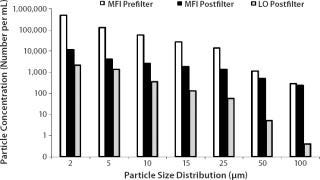
Figure 5: ()
Application to Cell-Containing Populations
Cell count, growth, and viability are the most common assays in biopharmaceutical discovery, expression system development, media design, and fermentation. Because of the limitations of manual hemacytometry, facilities that require frequent routine assays of count, viability, and size distribution often use computer-based vision systems, based on either Trypan Blue or fluorescence staining protocol (5). Commercial instruments deliver high productivity with onboard reagents, automatic sample handling, and staining. Because such systems are designed to perform specific assays, their optical configurations, image parameter analysis, sample volume/count analysis, sample preparation, data analysis routines, and presentation formats for results are assay-specific.
MFI technology is not limited to any specific assay. It measures the broadest possible data set for the particle population in a sample. Users define assays by selecting parameter filters, the sample volume/count to be analyzed, and presentation formats for results. Samples may be extracted from cell cultures, diluted if required, and drawn directly from a pipette tip into the flow cell. The instrument will detect, image, and measure morphological parameters for every particle in the sample. The system software can extract objects of interest such as cells of particular size, shape or contrast (or a combination) as well as culture fragments, nuclei, bubbles, and aggregates. Data can be presented in user-defined formats, such as histograms and contour plots with automatic cropping of filtered images. Large numbers of particles (>100,000) can be analyzed in a few minutes.
Results of the MFI Analysis of Cell Suspensions: To demonstrate the capabilities of the technology used in analyzing representative cell suspensions, MFI technology was used to measure a wide variety of cell types (Table 2). Other than adjusting sample concentration, no additional sample preparation steps were required. Figure 6 shows the results from three successive analyses of a K562 leukemia cell culture containing cells with a broad range of sizes and morphologies and a high concentration of debris. Size-distribution measurements were found to be highly repeatable. Figure 7 shows representative images. MFI results can be used to isolate cell populations from debris or to distinguish subpopulations of cell types from one another based on size (as shown) or any of the MFI morphological parameters (aspect ratio, circularity, and so on).
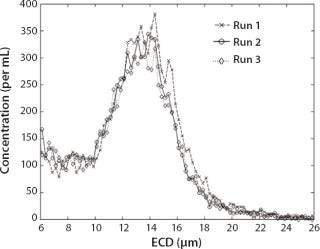
Figure 6: ()
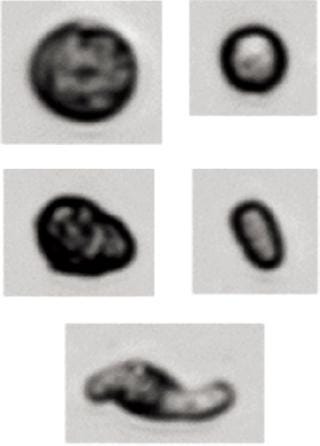
Figure 7: ()
Table 2: Cell suspensions analyzed by MFI
The value of morphological analysis in separating subpopulations is further demonstrated in Figure 8, which displays intensity against size for a mixed population of live and ethanol-lysed MDCK cells. The differences in particle image intensities allow those two cell populations to be readily distinguished.
Figure 9 outlines the results for some major particle categories found in a whole blood sample. This scatter plot of circularity against size separates the large population of red blood cells from other cell types and fragments.
Additional MFI Applications for Analyzing Cell Suspensions: MFI technology can provide unique and insightful analytical capability for analyzing cell suspensions. Some areas where these capabilities may be useful include drug discovery, analytical method development, culture media design and optimization, microcarrier analysis, and in-line monitoring to meet process analytical technology requirements.
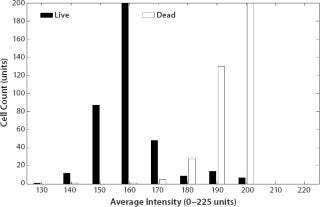
Figure 8: ()
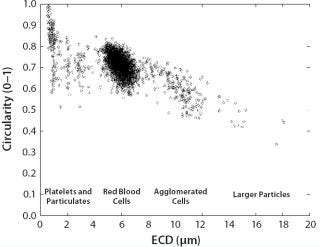
Figure 9: ()
Drug Discovery: In the discovery process, manual hemacytometry remains the workhorse for initial cell culture evaluation. MFI technology would be a useful complement to microscopy facilities, allowing users to assess cell culturing results rapidly and automatically, run automated versions of manual assays, and develop application-specific, morphology-based assays. Benefits would include speed, accuracy, sensitivity, objectivity, adaptability, additional information, and enhanced data gathering.
Prescreening and Protocol Development for Biochemical Analysis: Sample preparation protocols for expression analysis techniques such as flow cytometry generally require concentration adjustment and removal of significant populations of miscellaneous particles such as aggregates and cell culture debris. MFI technology can prescreen samples and optimize preparation protocols for these methods.
Media Design and Fermentation: The image and parameter data set gathered by MFI technology is unique. Multiparameter morphology filters can potentially identify useful indicators of growth or expression status that are not discernible by existing methods. If correlations can be established for unstained populations, new assays can be developed that require no contrast-enhancing or fluorescent-tagging protocols. An example would be correlating the population of cells isolated by a specific morphological parameter filter and the expression level of a particular molecule (6). Another example would be a correlation between isolated debris concentration and cellular necrosis (7).
Microcarrier-Based Cultures: Quantitative image analysis has been proposed as a means of extracting information from cultures of anchorage-dependent cells on microcarriers (8). The morphology parameters measured by MFI technology on suspended carriers and carrier clusters could assist in process control and optimization for such cultures.
Figure 1:
In-line Culture Analysis: MFI technology is a flow technology that can sample continuously from a process vessel. When dilution is required, it can be controlled by the instrument. If this technique is found to have value for cell culture characterization, in-line application may be justified by the opportunities provided by real-time data for fast identification of trends, process development, and control.
New Insight into Particle Analysis
MFI technology is an intelligent, computer-based vision technology that is finding an expanding role in analyzing particle populations found in biotechnology. The technique combines the insights of direct imaging with sensitive detection, rapid enumeration, multiparameter image morphology classification, flexible software-based image filtering, and automatic data archiving for a wide range of heterogeneous particle populations. These capabilities provide new insight into the analysis of the many different types of particle populations found in biotechnology.
For cell suspensions, MFI technology provides a unique and insightful orthogonal data set. Flow microscopy instruments could be a useful addition to microscopy/cytometry facilities, where they could perform initial cell culture assessments, automate project-specific assays, and assist in prescreening and protocol development for subsequent biochemical analysis. Additionally, if further investigation confirms that a data set provided by MFI technology contains information on the status of a cell culture with respect to growth and expression, new assays will be enabled that support media design and fermentation in suspension and anchorage-dependent cultures.
REFERENCES
1.) Huang, CT. 2008. Quantitation of Protein Particles in Parenteral Solutions Using Micro-Flow Imaging. J. Pharm. Sci. 1002/jps.21575 10.
2.) Sharma, DK. 2007. Flow Microscopy for Particulate Analysis in Parenteral and Pharmaceutical Fluids. Eur. J. PharmSci 12:97-101.
3.) Carpenter, JF. 2008. Overlooking Subvisible Particles in Therapeutic Protein Products: Gaps That May Compromise Product Quality. J. Pharm Sci. 1002/jps.21530 10.
4.) Moore, P. 14–17 October 2008.Case Studies Using Flow Microscopy for Contaminant AnalysisPDA Visual Inspection Forum, Berlin.
5.) Beckman-Coulter, Vi-CELL (www.beckmancoulter.com), innovatis AG, Cedex.
6.) Graf, H, JN Rabaud, and JM Egly. 1991. Screening of Various Mammalian Cell Culture Media to Establish a Downstream Purification Scheme. J. Immunol. Meth. 139:135-144.
7.) Pläsier, B. 1999. Automatic Image Analysis for Quantification of Apoptosis in Animal Cell Culture By Annexin-V Affinity Assay. J. Immunol Meth. 229:81-95.
8.) Pons, MN. 1992. Application of Quantitative Image Analysis to a Mammalian Cell Line Grown on Micro-Carriers. Biotechnol Bioeng. 40:187-193.
You May Also Like


