Artifacts of Virus Filter ValidationArtifacts of Virus Filter Validation
Virus filters are used in biomanufacturing to ensure the safety of biopharmaceutical drug products. As part of filter implementation, manufacturers are required to validate that the filtration process can indeed remove virus. Validations are typically performed at contract testing organizations (CTOs) that are “equipped for virological work and performed by staff with virological expertise in conjunction with production personnel involved in designing and preparing a scaled-down version of the purification process” (1). Virus removal capability of a filtration process is evaluated by a virus challenge or virus spiking study using a qualified scaled-down model of the filtration process.
A scaled-down model is used because the need for large volumes of virus and drug product make the cost of conducting large-scale filter testing impractical. This scaled-down model uses the same membrane and operating conditions (pressures and flows) as are in the manufacturing process. Ideally, virus is spiked into a representative drug product feed that has the same concentration, buffer, and production history as the manufacturing process. The virus-spiked feed is processed through a small-scale virus filter to the planned maximum volumetric throughput (L/m2). Then the feed and filtrate are assayed for virus concentration to determine the virus removal capability or log reduction value (LRV) using Equation 1.
Photo 1:

Photo 1: ()
Despite taking care to ensure that all practices we use during validation are in alignment with our large-scale manufacturing processes, artifacts are present that can potentially affect virus filter performance (throughput and LRV). These artifacts are listed in the “Artifacts” box.
PRODUCT FOCUS: BIOLOGICS, ESPECIALLY FROM CELL CULTURE PROCESSES
PROCESS FOCUS: DOWNSTREAM PROCESSING
WHO SHOULD READ: PROCESS DEVELOPMENT, ANALYTICAL, PROJECT MANAGEMENT
KEYWORDS: VIRAL SAFETY, VALIDATION, ASSAY QUALIFICATION, CONTRACT SERVICES, PREFILTERS, LOG-REDUCTION VALUE (LRV)
LEVEL: INTERMEDIATE
Some or all of these artifacts might be in play for any virus filter validation study. In most cases, even with all artifacts present, virus filter performance will be minimally affected. But in some cases, they can cause a study to fail and/or not meet its objectives (volumetric throughput and LRV targets). Here we highlight these issues and provide best practices that maximize the chance for success with all validation studies.
Nonrepresentative Drug-Product Feed (Feed History)
Increases in concentration, long hold times, freezing and thawing, and agitation of the feed can all contribute to an increase of aggregates in the drug product. Higher molecular-weight aggregates can cause a virus filter to foul (2, 3). Virus filters work primarily through size exclusion (4), as Figure 1 illustrates. Controlling changes to aggregate levels is the key to optimized virus filter performance. Achieving optimal filter performance is necessary to demonstrate the validity of the scaled-down model of the manufacturing process at the validation laboratory. Therefore, it is essential to understand the causes of drug product aggregation and manage the environment to prevent aggregation from occurring in the validation study.
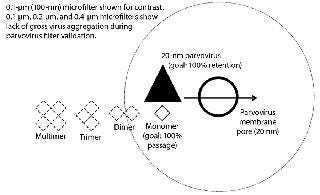
Figure 1: ()
Equation 1: Calculating the log-reduction value of a virus filter

where Cfd = concentration of virus in the feed; Vfd = volume of virus spiked feed processed through the filter; CF = concentration of the virus in the filtrate; and VF = volume of the filtrate
Nonrepresentative Concentration Adjustments: Many drug product manufacturers seek to cover worst-case processing conditions during validation. This is a sound approach provided that the worst case is still representative of the manufacturing process. One perceived worst-case scenario for virus filters is running the operation using a higher drug product concentration than is seen in manufacturing.
Increasing drug product concentration can negatively affect filter throughput. Virus filter plugging with relatively clean feed streams is believed to result from drug product aggregates. Increasing drug product concentration by ultrafiltration or adjusting the elution pool collection criteria for the upstream chromatography process could decrease the virus filter capacity because of an increase in aggregate concentration.
We recommend testing the effects of the elution pool collection criteria or an ultrafiltration process on virus filter performance before initiating a virus validation study. Compare the results with the concentration ranges that could occur from natural variations in your upstream chromatography unit operation.
Age, Freeze–Thaw, and Shipping Effects: The condition of a drug product feed used for virus validation is driven mostly by practical and logistical factors. Often, drug product production and virus-spike scheduling do not allow for a short lag time from drug product generation to study execution, which creates the need for long-term storage. In typical large-scale manufacturing processes, however, fresh nonfrozen feed is delivered to the virus filters directly from the upstream unit operation with minimal hold time.
Most manufacturers freeze a drug product before shipping it to a virus spiking laboratory. Although convenient, this is not part of the manufacturing process, and it may increase drug product aggregation (5). Figure 2 shows the reduction in virus filter throughput caused by freezing and thawing a drug product.
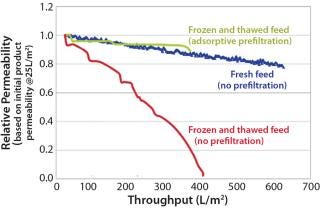
Figure 2: ()
If feed is shipped as a cold liquid, we recommend minimizing head space at the top of its shipping container(s) to avoid aggregate-inducing gas–liquid interfaces during shipment and storage.
We also recommend testing the effects of age, freezing and thawing, and shipping on virus filter performance prior to a virus validation study. The results should be compared with fresh, nonfrozen, and nonshipped feed — the state of the feed during a large-scale manufacturing process. If any of these artifacts are unavoidable, then an adsorptive prefilter can be used to restore feed to a condition that better represents large-scale manufacturing material (Figure 2).
Agitation During Microfiltration: Most, if not all, virus filter validations involve a microfiltration step after addition of virus to demonstrate that the virus is as monodispersed as possible and not grossly aggregated. Most laboratories use 0.1- to 0.2-μm filters for parvoviruses such as minute mouse virus (MMV), porcine parvovirus (PPV), and reovirus-3 (Reo-3) and 0.45-μm filters for larger viruses such as xenotropic murine leukemia virus (XMuLV), and pseudorabies virus (PRV).
If the virus were grossly aggregated, it would be easier for a virus filter to remove them (Figure 1). Conversely, monodispered virus represents the highest level of challenge for a virus filter. Virus-spiked drug product is sampled for virus before vacuum filtration. Afterward, vacuum-filter filtrate is sampled for virus and measured, then recorded as the viral load to the virus filter. A virus filter gets LRV credit only for the amount of virus challenged after the microfilter. Loss across the microfilter is usually minimal, about <0.5 log.
Artifacts of Virus Filter Validation
Nonrepresentative Drug Product (feed history)
Concentration adjustments
Drug product age
Frozen and thawed drug product
Agitation (during shipping or microfiltration after virus spike)
Mode of Operation
Handling an adsorptive prefilter in the validation environment
Constant pressure using pump or compressed air
Constant flow using pump
Process interruptions
Addition of Virus Spike
Virus spike percentage
Virus preparation purity
For vacuum microfiltration, we recommend using a low-level vacuum source to prevent too strong of a flow that could cause foaming. Place your vacuum unit at a 45° angle to allow filtrate to flow gently down the side wall of the collection container (Photo 1). These techniques minimize the chances of aggregate formation from gas–liquid interfacing. Filtration best practices typically support flushing of filters prior to use. Microfilters should be flushed with purified water to ensure removal of any particles that may exist in the filter and potentially plug a virus filter. This should be followed by a buffer flush to equilibrate the microfilter before drug product contact.
Occasionally, a drug product feed forms aggregates easily and is sensitive to additional handling. In such cases, vacuum filters should be eliminated altogether. Using a microfilter with a pressure source instead makes the microfiltration process gentler. It is also possible to skip the microfiltration step and apply virus-spiked feed directly to your virus filter. Confirmation of virus monodispersity may be accomplished by filtering an aliquot of the virus-spiked feed through a syringe microfilter. The LRV calculation uses the virus titer from the post-syringe filtrate as the concentration of virus in the feed to the virus filter to determine your filter LRV.
Restoring Nonrepresentative Drug Product Feed
Adsorptive depth filters can be very effective prefilters for virus filters (2, 3, 6). Drug product aggregates that are too small to be removed through size-exclusion prefiltration (such as using 0.1 to 0.2-μm microfilters) adsorb to these prefilters and prevent plugging of the downstream size-exclusion virus filter.
If your drug-product feed is shown to be nonrepresentative of manufacturing conditions because of an increase in product concentration, a long hold time, freezing and thawing, or shipping, then you can use an adsorptive prefilter to restore such a feed back to its representative state. This can be justifiable even if the adsorptive prefilter is not part of your manufacturing process. The biopharmaceutical manufacturer should generate data comparing virus filtration performance using a representative feed (fresh, nonfrozen, nonshipped) side by side with the virus filtration performance using nonrepresentative feed (aged, frozen and thawed, shipped). This comparison should clearly show how those factors make the feed nonrepresentative. Adding the adsorptive depth-filtered feed performance to the resulting graph would demonstrate that the feed has been restored back to a representative state (Figure 2). This is a practical solution to the logistical problems of performing validation studies.
Most drug products already use adsorptive depth filters in clarification after the bioreactor and data can be supplied proving that no biophysical measures of the drug product are affected by the adsorptive depth-filtration process at the virus filtration step. This data package supports use of the adsorptive depth filter in virus validation studies even though it is not present in the large-scale manufacturing process. The only other alternatives would be to generate fresh material with a preparative column at the virus-spiking laboratory or to resend new drug product samples that are not subjected to increased product concentration, long hold times, freezing and thawing, or shipping conditions.
Mode of Operation
Handling an Adsorptive Prefilter in the Validation Environment: Adsorptive depth filters are used in-line with virus filters in the manufacturing process to remove drug product aggregates and improve the performance and robustness of a virus filter (for more consistent filter performance from molecule to molecule and from batch to batch). If a prefilter is used in your manufacturing process, we recommend decoupling it from the virus filter during validation (Figure 3). A schematic of an in-line adsorptive prefilter is shown in Figure 4 for contrast.
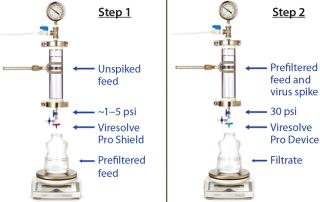
Figure 3: ()
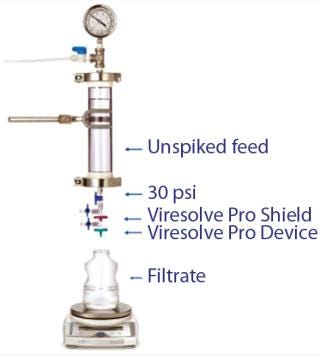
Figure 4: ()
In the decoupled mode, feed is filtered through the adsorptive prefilter, virus is spiked into that adsorptive prefiltered feed, and the resulting spiked feed is loaded onto the virus filter. The adsorptive prefilter should be operated by itself at a pressure that maintains the same flow rate or residence time as is seen when it is in-line with the virus filter. For example, at 30 psi, an adsorptive prefilter coupled with a 3.1-cm2 Viresolve Pro device has a flow rate of about 2–3 mL/min. When the adsorptive prefilter is decoupled, it must operate at a lower pressure (~3–5 psi) to achieve the same 2-3 mL/min flow rate. If the pressure were too high, the drug product feed would pass quickly through the prefilter, and its short residence time would not allow for aggregates to bind. That would cause the virus filter downstream to plug as if the drug product had not been prefiltered at all (6). After a prefiltered pool is generated, virus is spiked into it and then processed across the virus filter separately (Figure 3).
If virus is spiked across an adsorptive prefilter coupled in-line with a virus filter (Figure 4), then a significant amount of virus can be removed by the prefilter (7, 8). That is not desirable because the goal of a virus validation study is to achieve the highest possible LRV claim on the size-exclusion integrity-testable virus filter itself, rather than the adsorption-based nonintegrity-testable prefilter. That prefilter is there solely to improve the virus filter’s performance, not to remove virus. Another point to consider is the virus removal mechanism of the adsorptive prefilter. If its mechanism is the same as in a previously validated step (such as cation exchange specifically or adsorption generally), then regulatory bodies may not consider the prefilter to be an orthogonal approach to virus removal.
Because adsorptive prefilters are binding-site density dependent, they should be loaded according to the scaled-down volumetric throughput of a biomanufacturing process. Overloading them can lead to aggregate breakthrough and cause increased virus filter plugging. We also recommend using a dip tube on the adsorptive prefilter outlet to allow filtrate to gently collect into a container (Figure 5, LEFT). If feed is allowed to drip or splash into the collection container, then new aggregates can form due to gas–liquid interfacing and cause the virus filter to plug (Figure 5, RIGHT). In most cases, with proper residence time and filtrate collection, the decoupling process will provide about the same virus filter performance as the in-line combination (Figure 6). This behavior is something to evaluate before your validation study so that any impacts to the virus filter are not a surprise during the validation.
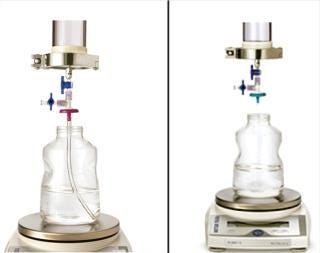
Figure 5: ()
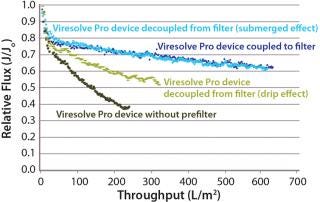
Figure 6: ()
Using Constant Pressure or Constant Flow
Constant Pressure Using Compressed Gas or Constant Flow Using a Pump: Some large-scale virus filtration processes use a pressurized tank and force drug product feed through the virus filter using gas pressure on top of the feed; some use a pump operated at either constant flow or constant pressure. The method implemented usually depends on the drug product manufacturer and their facility’s equipment availability and constraints. When it comes to the method of filtration for the validation study, small pressure vessels and pressurized gas are the simplest and easiest way to run the process. In fact, most process development is performed using this method. Figure 7 and Table 1 together show that applying constant gas pressure or using a pump with a constant flow at laboratory scale does not change the virus filter’s fouling profile or LRV achieved.
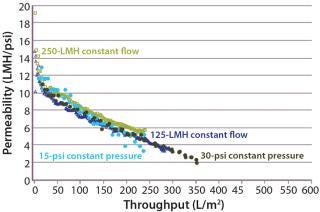
Figure 7: ()
Table 1: Comparing achieved LRV using constant flow and constant pressure operations
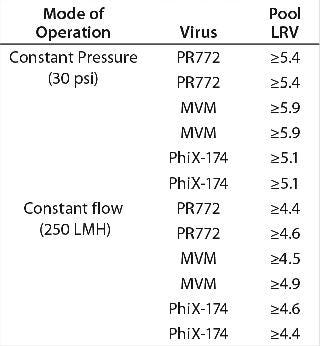
Table 1: Comparing achieved LRV using constant flow and constant pressure operations ()
Constant Pressure Using Compressed Gas or Constant Pressure using a Pump: Some virus filter users perform all virus filtration (scaled-down process development, pilot, validation, clinical, and manufacturing scales) using pumps. However, if previous process development and pilot work was done using only compressed gas but a pump will be used in manufacturing, then we recommend determining the impact of using a pump before validation testing begins. If there is no effect, then either mode of operating could be used in the study. Figure 8 shows an adsorptive prefilter in-line with a virus filter and the virus filter alone operated at constant pressure using a pump at pilot scale compared with using constant applied gas pressure at laboratory scale. For that particular feedstream, both modes of operation showed comparable virus filter performance
.
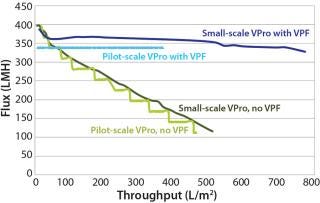
Figure 8: ()
Even though the feeds in Figure 7 and Figure 8 showed no difference in virus filter performance, the impact could be drug product specific. The mode of operation’s impact to virus filter performance should be verified by a drug product manufacturer before validation studies and full-scale manufacturing.
Process Interruptions
A number of scenarios may require stopping a virus filtration process for some period of time and then restarting it again later. Some large-scale virus filtration processes use bags or tanks to transfer drug product to and from the unit operation. It is conceivable that the load to the virus filter could be broken up into multiple bags and this might require the virus filtration process to have to be stopped and restarted.
In addition to these scenarios, usually a buffer flush is planned to maximize yield after drug product is loaded. That is another point at which a virus filtration process can be stopped temporarily and then restarted. These buffer flushes are important because they too are collected and added to virus filtration filtrate for further processing downstream. Unexpected stops can also occur due to equipment failure. A PDA conference presentation showed that process interruptions can affect LRV for some virus filters (10).
If your manufacturing process includes some planned pauses, then those stop-pressure/flow situations should be mimicked in your validation study to assess their effects on LRV. You should also investigate the potential impacts of unplanned process interruptions.
Addition of the Virus Spike
Virus Spike Percentage: Addition of the virus spike itself is an artifact that occurs only in validation studies. Several factors should be considered when choosing the optimal percent spike (one that achieves both target LRV and target throughput). Common virus spike percentages range from 0.1% to 1.0%. At typical virus titers, those percentages usually provide enough virus load to demonstrate a target LRV of >4–6. ICH recommends that a virus spike “should be added to the product in a small volume so as not to dilute or change the characteristics of the product. Diluted, test-protein sample is no longer identical to the product obtained at commercial scale” (1). Other factors to consider when determining virus spike percentage include cytotoxicity/interference of the virus assay as well as percentage of filtrate assayed. You can consult the CTO for more information regarding the details of the virus assay.
Virus Preparation Purity: Drug product manufacturers want to claim as high an LRV as possible, but impurities present in virus spikes can reduce virus filter throughput and cause a study to fail (11,12,13,14,15,16). We recommend verifying virus preparation quality with an R&D scoping study before beginning the official virus validation study. Consult the CTO and your filter vendor for more information about the impact of the virus spike on filter throughput.
Importance of the Baseline Run in the Validation Study: A baseline run should be performed at the start of any validation study before proceeding with virus spiked runs, whether the impact of possible artifacts are known a priori or not. This run would take a drug product feed sent for testing and run it through the virus filter with no spike. This run should be compared with previous process development data and scale-up data. This baseline run should simulate each step in the virus spiking process, including mixing performed after the virus spike and vacuum microfiltration.
Despite an increased feed concentration and hold time, freezing and thawing, shipping, and decoupled adsorptive prefiltration, if filter performance with the drug product matches previous data, then the baseline run has demonstrated a qualified, scaled-down model. It has also been verified that no artifacts are affecting the process. If differences are discovered, however, then you can take steps to mitigate the impacts of these artifacts on virus filter performance before you execute the validation runs with virus added. Once a baseline run has been successfully executed, you can proceed with virus spiking knowing that there are no issues involving the drug product feed or required validation procedures.
Plan Ahead for Success
It is difficult for the executers of virus filter validation studies to overcome the types of problems discussed above on the spot at the spiking laboratory. We have highlighted areas to be explored during process development before the validation study to ensure that such potential artifacts do not negate the scaled-down model. We recommend that their effects be tested and known before a virus spiking study begins. The greatest value of solving these issues in advance is that the baseline run can be executed and virus spiking runs can be performed as scheduled, with no surprises. Armed with this advanced knowledge, in addition to available high-quality virus spikes and optimized virus spike percentages, your virus validation study can proceed smoothly to a successful endpoint — at which your target LRV and optimized filter throughput are both achieved.
About the Author
Author Details
Paul Genest is a senior consulting engineer responsible for virus filtration applications at EMD Millipore Corporation, Cedric Geyer is a biomanufacturing engineer responsible for virus filtration applications at EMD Millipore Corporation, Joseph Parrella is a biomanufacturing engineer responsible for virus filtration applications at EMD Millipore Corporation and corresponding author Ashley Slocum is a biomanufacturing engineer responsible for virus filtration applications at EMD Millipore Corporation, 900 Middlesex Turnpike, Billerica, MA, 01821; 1-781-533-5786, 1-1781-533-8495; [email protected]. Horst Ruppach is the global manager for viral clearance, Marcel Asper is a study director for viral clearance, and Bill Evans is a scientist I at Charles River Laboratories International, Inc., 251 Ballardvale Street, Wilmington, MA 01887.
REFERENCES
1.) ICH Q5A 1998. Viral Safety Evaluation of Biotechnology Products Derived from Cell Lines of Human or Animal Origin. US Fed. Reg. 63:51074.
2.) Siwak, M.
3.) Brown, A. 2010. Increasing Parvovirus Filter Throughput of Monoclonal Antibodies Using Ion Exchange Membrane Adsorptive Pre-Filtration. Biotechnol. Bioeng. 106:627-637.
4.) Technical Report #41 2008. Virus Filtration (Revised 2008). PDA J. Sci. Technol supplement 6.
5.) Ireland, T. 2004. Viral Filtration of Plasma-Derived Human IgG: A Case Study Using Viresolve NFP. BioPharm Int. 1:38-44.
6.) Bolton, G, S Spector, and D. LaCasse. 2006. Increasing the Capacity of Parvovirus Retentive Membranes: The Viresolve Prefilter. Biotechnol. Appl. Biochem. 43:55-63.7.) Zhou, JX. 2008. Viral Clearance Using Disposable Systems in Monoclonal Antibody Commercial Downstream Processing. Biotechnol. Bioeng. 100:488-496.8.) Genest, P.. Alternative Virus Filter Validation Strategies: A Little Extra Effort During Validation Yields a Minimum Cost of Goods for the Life of Your Process.9.) Lutz, H. 2011. Qualification of a Novel Inline Spiking Method for Virus Filter Validation. Biotechnol. Prog. 27:121-128.10.) Asper, M.. Virus Breakthrough after Pressure Release During Virus Retentive Filtration.11.) Cabatingan, M. 2005. Impact of Virus Stock Quality on Virus Filter Validation. BioProcess Int. 3:S39-S43.12.) Parrella, J. 2009. A Complementary Virus Filter Spiking Method: A Solution to the Problem of Reduced Throughput Due to the Addition of the Virus Spike. PDA J. Pharm. Sci. Technol. 63:547-558.13.) Technical Report #47 2010.Preparation of Virus Spikes Used for Virus Clearance Studies, Parenteral Drug Association, Bethesda.14.) Asher, D. 2011. Predicting Virus Filtration Performance with Virus Spike Characterization. BioProcess Int. 9:26-37.15.) Slocum, A. 2013. Impact of Virus Preparation Quality on Parvovirus Filter Performance. Biotechnol. Bioeng. 110:229-239.16.) Asher, D. 2012. Virus Preparation for Filter Validation. Genetic Eng. Biotechnol. News 32.
You May Also Like


