Performance of a Salt-Tolerant Membrane Adsorber in Flow-Through ModePerformance of a Salt-Tolerant Membrane Adsorber in Flow-Through Mode
Monoclonal antibodies (MAbs) have become the most prevalent therapeutics in the biopharmaceutical industry. Their downstream purification typically involves protein A chromatography as a capture step followed by one or two additional chromatographic polishing steps. Additional unit operations dedicated specifically for viral clearance (e.g., viral inactivation and filtration) are added to ensure product safety. According to a survey of Amgen processes, after processing through a protein A column, only trace amounts of impurities such as Chinese hamster ovary cell protein (CHOP) (<3,000 ppm), high–molecular-weight (HMW) aggregates (<6%), leached protein A (<10 ppm), and host-cell DNA (<1 ppm) need to be removed to meet final product purity specifications. Chromatographic polishing steps traditionally use packed-bed resins, but such media entail some difficulties: slow transport of solutes to binding sites within bead pores and high pressure drops through the column even at moderate flow rates.
PRODUCT FOCUS: MONOCLONAL ANTIBODIES
PROCESS FOCUS: PURIFICATION
WHO SHOULD READ: PROCESS DEVELOPMENT AND ANALYTICAL
KEYWORDS: CHROMATOGRAPHY, HOST-CELL PROTEINS, SCALE-UP, LOT VARIATION, ELISAS, VIRUS CLEARANCE
LEVEL: INTERMEDIATE
Membrane adsorbers present an alternative to address those issues. These media are composed of cast porous membranes, the surface of which is modified with ligands to enable solute adsorption. One major difference between membrane adsorbers and resin beads is that pores are interconnected in the former and not so in the latter. Shorter diffusion paths in a membrane adsorber make immobilized ligands much more accessible to solutes.
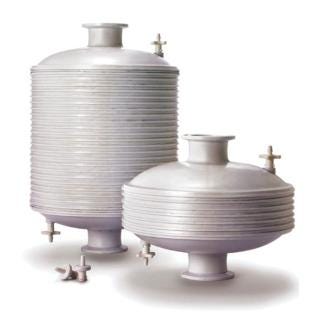
Figure 1: ()
Using an order-of-magnitude analysis of diffusive transport, the diffusion time scales as t ~ δ2/D for diffusivity D and diffusion distance δ. A virus with free solution diffusivity (1) of D = 6 × 10⁻⁸ cm2/s takes ~0.02 seconds to traverse the radius of a 0.65-µm diameter membrane pore (the average pore size of a ChromaSorb membrane adsorber from EMD Millipore). For a resin bead, solutes need to diffuse into stagnant pore fluid to reach the internal surface. Using a 45-µm diameter resin bead as an example, unhindered diffusion of 4.6 µm (half of the resin bead volume is its 4.6-µm thick outer shell) into the bead takes 3.5 seconds.
That difference in diffusion times enables running membrane adsorbers with much shorter residence times. Users can consistently and efficiently adsorb large, slowly diffusing solutes while running at high fluxes through a very thin adsorption bed of stacked membranes. Thin beds also give membrane adsorbers low flow resistance. Also, membrane adsorbers provide the following advantages (2, 9):
no column packing
disposability
small footprint in production facilities
low buffer consumption
short processing time.
Membrane adsorbers based on ion-exchange, hydrophobic-interaction, and affinity principles have been applied to MAb purification (3,4,5,6,7,8,9,10,11,12,13,14,15,16,17,18,19). Commercial and experimental membrane modules have been studied to evaluate their performance in both bind–elute and flow-through modes. Using anion-exchange (AEX) membrane adsorbers in flow-through mode as polishing steps has shown the most promising results in binding capacity and impurity removal. But AEX-type membrane adsorbers with quaternary amine ligands have performed well only at low conductivities (<6 mS/cm). Loads often need to be diluted due to their high conductivity. New membrane adsorbers using primary amine ligands (e.g., poly(allylamine), PAA) can tolerate much higher conductivities (≤~30 mS/cm) (14, 16,17,18,19). Riordan et al. studied viral clearance using membrane adsorbers with different amine ligands and concluded that three ligand factors were contributing to salt tolerance: net charge, molecular structure, and immobilization density on the membrane (19). In addition to the electrostatic attraction forces, hydrogen bonding forces play a particular role in solute adsorption (14, 19).
Downstream purification operations are being challenged (20, 21) to process large MAb quantities produced by high-titer mammalian cell culture, with expression levels of 10 g MAb/L currently feasible. At large scales, the size of chromatographic columns and storage tanks may present throughput bottlenecks. Salt-tolerant membrane adsorbers are particularly useful for addressing this challenge. Large amounts of material can be processed through a relatively small membrane device (as a flow-through polishing step) due to its high capacity. Tank-size bottlenecks can be mitigated when feed streams (even at high salt concentrations) can be directly loaded without dilution.
Our study uses a salt-tolerant membrane adsorber in a flow-through mode as a final polishing step (Figure 1). We evaluated CHOP clearance for partially purified MAbs at different loadings, pH levels, conductivities, MAb concentrations, and flow rates, using a number of buffer and salt conditions. We also assessed virus clearance and measured CHOP removal between devices of different sizes to evaluate scalability. To evaluate lot-to-lot variation, we measured CHOP removal between devices of different lots. Finally, we measured CHOP removal with devices operated in series to show the concept’s feasibility.
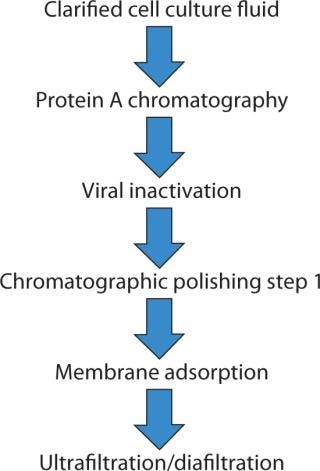
Figure 1: ()
Materials and Instruments
Materials: All buffers (Table 1) were prepared with reagent-grade chemicals and purified water, then filtered through 0.2-µm filters before use. CHO-expressed recombinant humanized MAbs from Amgen were partially purified by protein A chromatography and cation-e
xchange (CEX) polishing. We adjusted the pH and conductivity of our MAb solutions and prefiltered them through 0.2-µm filters before use. Amgen also provided stocks of xenotropic murine leukemia virus (XmuLV), propagated and purified as described elsewhere (22).
Table 1: Buffers used
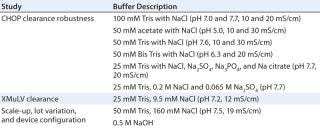
Table 1: Buffers used ()
EMD Millipore provided 0.08-mL and 50-mL ChromaSorb membrane adsorber devices, Sterivex sterile filter units, and Express SHC Opticap XL3 filter units. We purchased 0.2-µm and 0.45-µm Nalgene bottle filter units from Nalge Nunc International (Rochester, NY).
Instruments: For our membrane chromatography studies, we used an ÄKTA Explorer 100 system with UNICORN protein purification software from GE Healthcare (Uppsala, Sweden), a peristaltic pump from Ismatec (Glattbrugg, Switzerland), and a Masterflex L/S peristaltic pump from Cole Palmer Instrument Company (Vernon Hills, IL). With the Ismatec pump, we used a Millipore data acquisition system including load cells from Product Resources Inc. (Beverly, MA) for volume measurement and disposable pressure transducers from PendoTECH (Princeton, NJ) for operating pressure measurement, collecting volume, pressure, and time data with a personal computer. A Mettler Toledo pH meter measured pH levels with an InLab Expert Pro pH and conductivity with an InLab 730 conductivity probe (Columbus, OH). We used a UV spectro-photometer 8453 from Agilent Technologies (Santa Clara, CA) to measure protein concentration.
Experimental Methods
Evaluating CHOP Reduction and Process Robustness: To evaluate the 0.08-mL membrane adsorber devices in flow-through mode for CHOP reduction, we first prepared them by slowly displacing the air in them with purified water. An EMD Millipore user guide details the procedure (23). Our membrane chromatography operation used either the ÄKTA Explorer system or the Ismatec peristaltic pump. We flushed the devices with equilibration buffer until pH and conductivity at their outlets matched the equilibration buffer specifications.
Except when studying flow-rate effects, we loaded partially purified MAb feed streams on the devices at 1 mL/minute, 12.5 membrane volumes (MV) per minute. Fractions were collected to generate CHOP breakthrough curves. In other cases, we flushed the membrane devices with equilibration buffer at the end of loading and collected pools to calculate device capacities and step yields. We analyzed MAb protein concentrations with the UV spectrophotometer at 280 nm, followed by an Amgen in-house CHOP assay, monitoring volume and operating pressure during all runs.
The pressure drop increased from 3 to 38 psid across the 0.08-mL membrane adsorber devices during the course of processing our MAb solution on the ÄKTA Explorer 100 system using 0.75-mm i.d. polyether-etherketone (PEEK) tubing. The effect was repeatable using another MAb. The MAb solution was batch prefiltered through a 0.2 µm filter, leaving no particles in the feed solution to plug the 0.65-µm adsorber membrane. In-line addition of a 4.5-cm2 Millex 0.2-µm filter (EMD Millipore #SLGV033RB) before the 0.08-mL adsorber delayed but did not eliminate onset of the pressure rise. In-line addition of a larger 10-cm2 Sterivex 0.2-µm self-venting filter (EMD Millipore #SVGPL10RC) before the 0.08-mL adsorber did eliminate it. So we used that filter for further testing of all the 0.08-mL devices.
Small air bubbles appeared in the PEEK tubing, most likely formed by liquid degassing as pressure declined through the small-diameter tubes. We also saw the pressure rise with a peristaltic pump using 1.14-mm i.d. tubing, but not with 1.65-mm i.d. tubing. To determine whether air locking caused the pressure rise, we deliberately introduced air and then pumped liquid into 0.08-mL and 50-mL devices. That caused the pressure to rise to only 25 psid before the air was forced through the membrane, with the pressure leveling off at this “bubble point” or multilayer intrusion pressure (24). Further liquid flow eventually evacuates trapped air, so the pressure declines to its original value. The pressure rose to 38 psid (higher than the 25-psid intrusion pressure), but it did not decline with additional flushing, so the filter must have irreversibly plugged. As noted above, batch prefiltration did not remove plugging agents, but in-line prefiltration immediately before the membrane adsorber did. So the plugging agents must have formed in line and occurred with small-diameter tubing.
XMuLV Clearance Study: For our viral clearance study, we ran 0.08-mL membrane adsorber devices the same as above using the Ismatec pump, a different equilibration buffer, and a different load. We spiked partially purified MAb feed streams at pH 7.2 and two conductivities (14 and 18 mS/cm) with XMuLV at 1% by volume (105.6 pfu/mL), then filtered the spiked loads through 0.45-µm filters after gentle mixing. After loading the above feed streams ≤20 kg MAb/L membrane at 1 mL/minute, we used 5 mL of equilibration buffer to flush the membrane devices and collected four fractions (each representing 5 kg MAb/L membrane loading). Mixing the same volume of sample from each of those fractions created a miniature pool. We analyzed these samples using an Amgen in-house XMuLV infectivity assay, monitoring volume and operating pressure during the run using an EMD Millipore data-acquisition system.
Evaluating Device Scale-Up and Lot-to-Lot Variation: Again, we ran the 0.08-mL membrane adsorber devices as above using the Ismatec pump, a different equilibration buffer, and a different load. We prepared the 50-mL membrane adsorber devices by slowly pumping purified water through them in a tilted orientation, with an upward-facing vent in the open position (24). A Masterflex L/S peristaltic pump operated for the 50-mL device at 625 mL/minute (12.5 column volumes per minute for all devices).
We sanitized our membrane devices with 0.5 M NaOH for 30 minutes, then equilibrated with 50 mM Tris and 160 mM sodium chloride at pH 7.5 and 19 mS/cm. After loading the partially purified MAb feed stream (pH 7.4 and 23 mS/cm) ≤16 kg MAb/L membrane, we flushed the devices with equilibration buffer for product recovery. Again, four fractions were collected and analyzed using the Amgen in-house CHOP assay, monitoring volume and operating pressure with the data-acquisition system. We also tested air-diffusion integrity on the 50-mL membrane device.
Testing Membrane Device Configurations: We evaluated a single 0.08-mL membrane adsorber device and an assembly of four 0.08-mL devices in series for CHOP and bovine serum albumin (BSA) removal. To maintain residence time, we ran all devices at the same 1-mL/minute flow rate. These experiments were performed as described above.
Analytical Assays: We determined MAb and BSA protein concentrations by UV absorbance at 280 nm, sample dilution factor, and MAb extinction coefficient. Our enzyme-linked immunosorbent assay (ELISA) for CHOP level analysis was developed by Amgen, as was the infectivity assay for analyzing XMuLV titers (26, 27).
Results and Discussion
Evaluating CHOP Removal and Process Robustness:Figure 2 shows typical CHOP breakthrough curves using partially purified MAb feed streams. CHOP breakthrough is sensitive to the grams of CHOP per liter of membrane loading; it is relatively insensitive to pH and conductivity over the range tested. At 4 g CHOP/L, the MAb loading was 11 kg/L. We chose 10–20 kg MAb/L membrane throughput to evaluate the membrane adsorber. It reproducibly provided CHOP reduction >80% with multiple MAbs at a range of buffer conditions (pH 7.0–8.0, conductivity <20 ms/cm) for MAbs with high isoelectric points (pI ~8.7) and for loading ≤10 kg MAb/L membrane. But a MAb with a relatively low pI (~7.0) in a wide range of buffer conditions (pH 6.6–8.0, conductivity 5–20 mS/cm) showed <30% CHOP reduction at 10 kg MAb/L membrane loading. We recommend testing with additional low-pI molecules to generalize this trend.
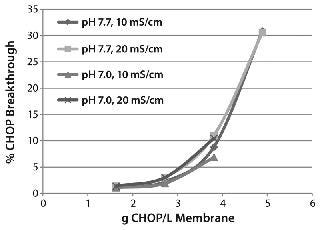
Figure 2: ()
We studied CHOP reduction in a full-factorial design with duplicate center points to find critical operating parameters and their ranges for good membrane adsorber performance. The study included three factors at two levels with expanded range: pH at 5.0 and 7.6, conductivity at 10 and 30 mS/cm, and load factor at 10 and 20 kg MAb/L membrane. Center-point replicate conditions were pH 6.3, conductivity 20 mS/cm, and load factor 15 kg MAb/L membrane. Figure 3 shows our statistical analysis results. Conductivity is not a statistically significant factor; the membrane adsorber demonstrated good salt tolerance to 30 mS/cm. Load factor and pH are statistically significant factors. But pH range in commercial MAb purification processes can be very well controlled — within 0.3 pH units (from 6.7 to 7.0) — and CHOP reduction is essentially unchanged over that range, so pH has no practical significance.
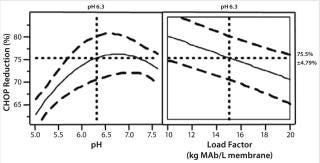
Figure 3: ()
We evaluated load MAb protein concentration and flow-rate effects on CHOP reduction by loading a partially purified MAb (pI 8.8) solution at pH 7.5 and 20 mS/cm on the 0.08-mL membrane adsorber at 12.5 MV/min. Results showed that CHOP reduction was insensitive to the load MAb concentration from 20 to 40 mg/mL. Over 95% CHOP reduction (from 300 ppm in the load to ~15 ppm in the flow-through pools) was achieved at 10 kg MAb/L membrane loading for both concentrations. We tested performance of the 0.08-mL membrane adsorber at different flow rates with a partially purified MAb solution at pH 7.4 and 20 mS/cm (MAb pI 8.8, load protein concentration 23 mg/mL). Results showed that CHOP removal was also insensitive to flow rate — from 12.5 (manufacturer recommended) to 37.5 MV/minute. We observed ~95% of CHOP reduction (from 399 ppm in the load to ~20 ppm in the flow-through pools) at 13 kg MAb/L membrane loading. Such a lack of sensitivity to flow rate is not surprising because the contact time (1.6–4.8 seconds) is still much larger than the 0.02 seconds of estimated diffusion time for a large virus particle.
Table 2 lists our results from evaluating the effects of multivalent salt and buffer anions on CHOP breakthrough, which at the same buffer conductivity was higher in the presence of phosphate, citrate, and sulfate anions than with chloride anions. Additional testing with sulfate and chloride at the same ionic strength showed the same effect. These data suggest that multivalent anions compete for adsorption with the CHOP and bind more tightly to the PAA coating (28). Those anions may also effectively act as ionic cross-linkers for the PAA gel coating, thus limiting its accessibility to larger CHOP proteins.
Table 2: Effects of multivalent salt/buffer anions on CHOP breakthrough
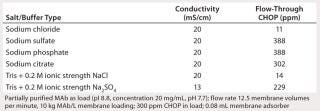
Table 2: Effects of multivalent salt/buffer anions on CHOP breakthrough ()
XMuLV Clearance Study: We evaluated XMuLV clearance by the 0.08-mL membrane adsorber at one pH and two conductivity levels (Figure 4). No virus was detected in the flow-through pool with a loading ≤10 kg MAb/L membrane, so we determined the virus log-reduction value (LRV) by sampling error. As the upward arrows in the figure show, >4 LRV can be claimed at this throughput. Virus was detected in flow-through pool with the MAb loading >10 kg/L membrane, and viral clearance was insensitive to feed solution conductivity (14–18 mS/cm). We did observe a small pressure increase (from 1 to 5 psi) during the course of virus-spike processing, but the operating pressure at the end of the run was still much lower than the manufacturer-recommended device limit of 30 psi.
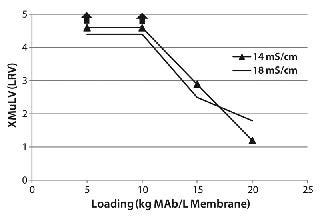
Figure 4: ()
Evaluating Device Scale-Up: Six 0.08-mL membrane adsorber devices and one 50-mL device used in this scale-up study were specially manufactured to have identical layered membrane lots. They were also designed to have the same numbers of membrane layers for linear scaling. All the 0.08-mL devices ran in parallel at the same time as the 50-mL device using the same feed. This experiment was designed to compare performance at different scales with regard to CHOP removal, yield, and operating pressure profile.
Figure 5 shows CHOP breakthrough curv
es for the 0.08-mL and 50-mL devices. For the 0.08-mL devices, the CHOP level mean and sample standard deviation (σ) were calculated at each loading point and used to estimate the error range as the mean ±2σ. The CHOP level for the 50-mL device was lower than the average for the six 0.08-mL devices at each loading point. If multiple 50-mL devices had been tested (not practical with the large quantity of MAb material needed), a similar error magnitude to that for the 0.08-mL devices would be expected around the mean of the 50-mL devices. The error ranges between both devices would overlap, indicating equivalent performance between the 0.08-mL devices and the 50-mL device.
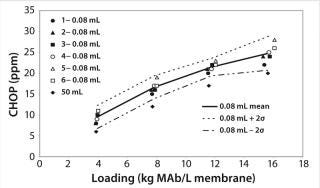
Figure 5: ()
We calculated CHOP and MAb concentrations in the flow-through pools at 16 kg MAb/L membrane loading from the volumes and concentrations of the four collected fractions. Table 3 details CHOP reductions and process yields. CHOP in the flow-through pool averaged 18 ppm for the 0.08-mL devices and 14 ppm for the 50-mL device. Those values correspond to 96% and 97% CHOP reduction, respectively. The average yield for the 0.08-mL devices was 98.1%, and that for the 50-mL device was 98.9%. These are the expected recoveries and show no significant difference between the different sizes. Some variability in the yield data could be attributed to potential error in sample preparation for the UV absorbance readings, for which a 41× dilution was performed.
Table 3: CHOP reduction and yield for flow-through pool at 16 kg MAb/L membrane throughput

Table 3: CHOP reduction and yield for flow-through pool at 16 kg MAb/L membrane throughput ()
We monitored operating pressure from the 0.08-mL devices and the 50-mL device during our scale-up study. All devices showed pressure increases <2 psi throughout loadings of ≤16 kg MAb/L membrane. Pressure profiles were comparable for all devices.
Evaluating Device Lot Variation: We ran four 0.08-mL membrane adsorber devices manufactured from four different membrane lots spanning the entire manufacturing range of BSA binding capacity as duplicates and in parallel with the same feed at the same time. This experiment was designed to compare performance of devices with different membrane lots (a single lot of membrane in each device) for CHOP reduction, yield, and operating pressure profiles. It also allowed us to evaluate a potential correlation between CHOP reduction and BSA binding capacity. Table 4 lists membrane lots and their BSA binding capacities (in milligrams of BSA per milliliter of membrane at 0 mM NaCl).
Table 4: CHOP reduction and yield for flow-through pool at 16 kg MAb/L membrane throughput

Table 4: CHOP reduction and yield for flow-through pool at 16 kg MAb/L membrane throughput ()
Figure 6 shows CHOP breakthrough curves from different 0.08-mL device membrane lots with same MAb feed solution. Individual data points correspond to duplicate runs of four membrane lots with 54.0–93.9 mg BSA/mL membrane BSA capacities. The curves are drawn by taking the average CHOP from duplicate runs for each lot. All membrane lots showed same trend of breakthrough curves, but we found no clear relationship between CHOP removal and membrane BSA capacity.
Equations
The following equations are used in determining the velocity of a constant concentration point on an adsorption front (30, 31). For a two-dimensional system, concentration c varies only with adsorption bed length x and time t (Equation 1):

The velocity of a point with constant concentration is obtained for dc = 0 by Equation 2:

A component mass balance can be used to find those partial derivatives. For a differential element dx along the length of the adsorption bed with bed porosity ε (interstitial volume/bed volume), fluid concentration c (g/L bed), adsorbent concentration q (g/L bed), and superficial velocity vε (volumetric feed flow/bed cross sectional area), the component mass balance is Equation 3:

(for axial diffusion and dispersion << axial convection).
Assuming fast mass transport so that the system is in equilibrium, the velocity of a point with constant concentration is obtained by expanding and substituting Equation 3 into Equation 2:

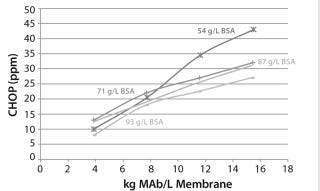
Figure 6: ()
Figure 7 includes the results of a statistical analysis correlating the average CHOP breakthrough with membrane BSA capacity. The low correlation coefficient R2 value of 0.37 indicates that only ~37% of the variation in CHOP reduction is explained by the different BSA capacities. The shallow slope of the best-fit regression line indicates that CHOP reduction is insensitive to BSA capacity. All membrane lots showed overall good CHOP reduction even though their BSA binding capacities covered a wide range. This insensitivity of CHOP reduction to membrane lot variability suggests a robust process, so an additional safety factor is not required to account for differences in membrane lots.
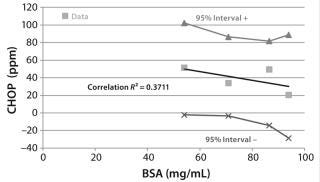
Figure 7: ()
CHOP and MAb concentrations for the flow-through pools at 16 kg MAb/L membrane loading are calculated from the volumes and concentrations of the four fractions. Table 4 shows CHOP reduction and process yields, with duplicate runs from each device labeled A and B. The CHOP reduction range was 95 ± 2%, and the yield range was 98.6 ± 0.6%. Those ranges are tight, and the results are consistent with those from our scale-up study. Pressure over the course of the runs increased within 2 psi of the starting pressure, and pressure profiles were comparable for all four devices.
Testing Membrane Device Configurations: Consider an example 15 kg MAb batch that requires 1.5 L of membrane adsorber at 10-kg MAb/L membrane throughput. Figure 8A shows a single 1.5-L module with internal parallel flow; Figure 8B shows three 0.5-L modules in parallel. Permeability variations among modules can cause unequal throughputs, requiring an extra safety factor for sizing to ensure that no modules process more than the validated throughput. A relative standard deviation in permeability of 25% could require a safety factor of 1.5. Flow through each module can be equalized by using added resistances in line (Figure 8C), flow controllers or valves (Figure 8D), or pumps (Figure 8E). A smaller safety factor is required to compensate for residual variation among those options. Figure 8F shows a configuration for running each module in a successive sequence, which requires starting and stopping each parallel leg in sequence. That configuration also takes three times the processing time. And Figure 8G shows three modules in series configuration. Keeping the same module residence time requires a process taking three times longer. That final series option provides the most simplicity apart from using larger modules.
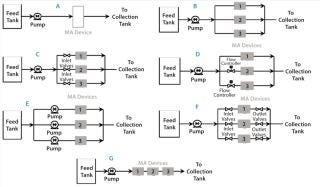
Figure 8: ()
Figure 9 shows CHOP breakthrough curves from a single 0.08-mL membrane adsorber device and an assembly of four 0.08-mL devices in series, with both curves comparable. Pressure drop across four devices in series was roughly four times that from the single device, as expected. Although pressure increased slightly over the course of the run, it remained well below the 30-psi module limit. If this configuration is to be used at manufacturing scale, then small-scale qualification and viral validation would need to be run in the same configuration to meet regulatory requirements.
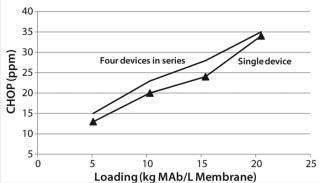
Figure 9: ()
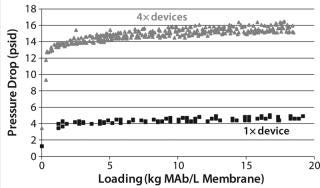
Figure 10: ()
The CHOP breakthrough curves in Figure 9 are similar in shape for single and longer–bed-length series operations. Different points along the CHOP adsorption front all have similar velocities. As the “Equations” box details, the velocity of a constant concentration point on the adsorption front is

where q’ is the slope of the isotherm q(c), v is the interstitial average fluid velocity, and ε is the interstitial bed porosity. Even if CHOP adsorbs as a mixture of heterogeneous components, with each point on the breakthrough curve corresponding to a different mix of those components, then the different mixtures along the front have a similar isotherm slope q’ = K. For the commonly used Langmuir isotherm, this slope K is identified as the equilibrium binding constant between the adsorbent surface and free solution. The CHOP capacity and adsorption-front velocity is controlled by K and is sensitive to the ligand binding energy ΔG = –RTlnK.
The BSA breakthrough curve (Figure 11) flowing through additional bed length in series operation is more closely described by a step change than is the single device. For a strongly binding component with a convex or type I isotherm (29), q′ = 0 with velocity v at high concentrations, whereas q′ = K > 0 with a slower velocity v/(1 + K/ε) at low concentrations. Low-concentration points along the rear of the adsorption front have a higher velocity than the high-concentration points along its leading edge, causing the front to “self-sharpen.” Eventually, it develops a constant, sharpened, step-like shape in which all points move at the same velocity with q′ = qmax/cin. The BSA capacity and adsorption-front velocity are controlled by the maximum adsorption loading qmax, where q’ = 0 and is sensitive to the ligand density. CHOP and BSA capacities are controlled by different ligand attributes and thus should be uncorrelated. Our analysis supports the data from the lot variation study and gives more confidence that CHOP breakthrough is insensitive to membrane lot variation.
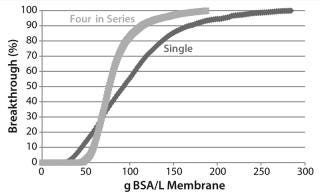
Figure 11: ()
Results and Conclusions
We have demonstrated the feasibility of a novel salt-tolerant AEX membrane adsorber as a polishing step in flow-through mode for MAb purification. The membrane adsorber performed well when placed after protein A capture and CEX polishing. CHOP reduction is insensitive to conductivity, pH, MAb concentration, and flow rate when MAbs have a high pI (>8.0), and the operating pH is at ~1 unit below the pI of the molecule. CHOP reduction is sensitive to CHOP loading and multivalent buffer/salt anions. We observed viral clearance of >4 LRV of XMuLV at ≤10 kg MAb/L membrane throughput for 14–18 mS/cm conductivities.
Our scale-up study showed that CHOP reduction, yield, and pressure drop were comparable for 0.08-mL and 50-mL devices using the same feed and membrane lots. A lot-variation study showed that CHOP reduction, yield, and pressure drop were comparable among lots with membrane BSA capacities of 54–94 mg/mL. Correlation between membrane BSA capacity and CHOP reduction was statistically poor, with a slope that showed insensitivity — consistent with the theory of adsorption fronts.
The 0.08-mL membrane adsorber is a representative scale-down model for characterizing performance and determining device sizing in process development. The membrane adsorber polishing step was found to be robust; a relatively small, if any, additional safety factor would be needed to account for differences in membrane lot performance. Operation in a series configuration may be a viable scale-up option.
Membrane adsorbers have high throughputs and show value for trace contaminant removal applications, where they would be much smaller than columns for the same use. Salt tolerance enhances their value by reducing the need for dilution (and the associated large tanks). Process-scale application for host-cell protein removal requires a high MAb pI and feed with low levels of contaminants for high MAb loading capacity. Membrane adsorbers come ready to use (no column packing), are disposable (no cleaning), and offer short processing times with low buffer consumption.
This report does not represent an Amgen endorsement of any products described herein. It is not meant to imply that Amgen uses any of these products for clinical or commercial manufacturing. Portions of our study were presented previously (16).
About the Author
Author Details
XueJun Han and Tony Hong are scientists, Xiaoyang Zhao is a senior scientist, and Art Hewig is director of purification process development at Amgen Inc. Corresponding author Herb Lutz is principal consulting engineer, Kate Chefer is a process development scientist, Alejandro-Becerra-Arteaga is an applications engineer, Venkatesh Natarajan is principal applications engineer, all in manufacturing sciences; and Mark Blanchard is a scientific fellow in R&D at EMD Millipore. EMD Millipore Corporation, 6220 Pacific Avenue, #103, Playa del Rey, CA 90293; [email protected]; 1-310-309-0984.
REFERENCES
1.) Van Holde, KE. 1971.Physical Biochemistry, Prentice-Hall, Englewood Cliffs:89.
2.) Gottschalk, U. 2008. Bioseparation in Antibody Manufacturing: The Good, the Bad, and the Ugly. Biotechnol. Prog. 24:496.
3.) Roper, DK, and EN. Lightfoot. 1995. Separation of Biomolecules Using Adsorptive Membranes. J. Chromatogr. A 702:3.
4.) Thommes, J, and MR. Kula. 1995. Membrane Chromatography: An Integrative Concept in the Downstream Processing of Proteins. Biotechnol. Prog. 11:357.
5.) Brandt, S. 1988. Membrane-Based Affinity Technology for Commercial-Scale Purification. Bio/Technol. 6:779.
6.) Charcosset, C. 1998. Purification of Proteins By Membrane Chromatography. J. Chem. Technol. Biotechnol. 71:95-110.
7.) Zeng, X, and E. Ruckenstein. 1999. Membrane Chromatography: Preparation and Application to Protein Separation. Biotechnol. Prog. 15:1003-1019.
8.) Ghosh, R. 2002. Protein Separation Using Membrane Chromatography. J. Chromatogr. A 952:13-27.
9.) Phillips, M. 2005. Performance of a Membrane Adsorber for Trace Impurity Removal in Biotechnology Manufacturing. J. Chromatogr. A 1078:74-82.
10.) Zhou, X. 2006. New Q Membrane Scale-Down Model for Process-Scale Antibody Purification. J. Chromatogr. A 1134:66-73.
11.) Zhou, X, and T. Tressel. 2006. Basic concepts in Q Membrane Chromatography for Generous Scale Antibody Production. Biotechnol. Prog. 22:341-349.
12.) Etzel, MR, and WT. Riordan Shukla, AA, MR and S. 2007.Membrane Chromatography: Analysis of Breakthrough Curves and Viral ClearanceProcess Scale Bioseparations for the Biopharmaceutical Industry, CRC Press, Boca Raton:277.
13.) Boi, C. 2007. Membrane Adsorbers As Purification Tools for
Monoclonal Antibody Purification. J. Chromatogr. B 848:19-27.
14.) Phillips, M. A Fundamental Understanding of a Novel Membrane Adsorber Technology.
15.) Kuczewski, M. 2010. Development of a Polishing Step Using a Hydrophobic Interaction Membrane Adsorber with a PER.C6-Derived Recombinant Antibody. Biotechnol. and Bioeng. 105:296.
16.) Lutz, H. 2011.. BIOT-8: Performance of a Novel Salt Tolerant Membrane Adsorber in Flow-Through Mode.
17.) Mehta, A. 2011.. BIOT-7: Salt Tolerant Membrane Adsorbers for Large Scale Polishing in Flow-Through Mode.
18.) Woo, M. 2011. A Novel Primary Amine-Based Anion Exchange Membrane Adsorber. J. Chromatogr. A 1218:5386-5392.
19.) Riordan, W. 2009. Design of Salt Tolerant Membrane Adsorbers for Viral Clearance. Biotechnol. and Bioeng. 103:920-929.
20.) Kelly, B. 2007. Very Large Scale Monoclonal Antibody Purification: The Case for Conventional Unit Operations. Biotechnol. Prog. 23:995.
21.) Kelly, B. 2009. Industrialization of MAb Production Technology: The Bioprocessing Industry at a Crossroads. MAbs 1:443-452.
22.) Romanowski, P. 2008. Variables Affecting Titer and Long-Term Stability of Virus Stocks. BioProcess Int. 6:44-52.
23.) Lit. #00105653PU, Rev. B 2010..
24.) Einstein, A, and H. Muehsam. 1923. Experimental Determination of Pore Size in Filters (in German). Dtsh. Med. Wocenhr. 49:1012-1013.
25.) Lit. #00110203PU, Rev. A.
26.) Spearman, C. 1908. The Method of Right or Wrong Cases (Constant Stimuli) without Gauss’s Formulae. Br. J. Psychol. 2:227.
27.) Karber, G. 1931. 50% End-Point Calculation. Arch. Exp. Pathol. Pharmak. 162:480-483.
28.) Holmes-Farley, SR. 1999. Design and Characterization of Sevelamer Hydrochloride: A Novel Phosphate-Binding Pharmaceutical. J. Macromol. Sci. Pt. A 36:1085-1091.
29.) Brunauer, S. 1940. On a Theory of the Van der Waals Adsorption of Gases. JACS 62:1723-1732.
30.) Goldstein, S. 1953. On the Mathematics of Exchange Processes in Fixed Columns. I. Mathematical Solutions and Asymptotic Expansions. Proc. Roy. Soc. (London) A219, 1137:151-171.
31.) Sherwood, TK, RL Pigford, and CR. Wilke. 1952.Mass Transfer, McGraw-Hill:554.
You May Also Like


