Biopharmaceutical Information Infrastructure 2.0 December 2009Biopharmaceutical Information Infrastructure 2.0 December 2009
Availability of the right information to the right people at right time is critical for understanding and improving existing processes within an organization. For a data-intensive industry such as biopharmaceuticals development and manufacturing, access to data and information enables companies to understand and streamline their operating and business processes. But most organizations fail to leverage such information for better decisions because they mismanage it. Some try to fill the gap between information and end users by introducing various applications and building data repositories but suffer from inherent complexities involved in integrating disparate sources.
This two-part article explores some related tools and technologies biopharmaceutical companies can leverage to build an efficient mechanism for capturing and delivering valuable information. In this issue, Part 1 focuses on infrastructure selection and how hardware, software, and information systems form an ecosystem. Simplicity, sustainability, and scalability can be achieved only when the trio is designed from a holistic perspective. We further explore structured data capture and analysis tools.
Challenges and Obstacles
Various tools are on the market for information management, but many fail to gain popularity because of low adoption and use rates. Adoption rate refers to the degree to which companies purchase tools for their employees. The major obstacle in the adoption of a tool is the “time and complexity to deploy” it. Most tools have complex architectures that organizations can find difficult to customize for their own specific needs. It can be difficult for them to realize the full benefits of such tools.

Use rate refers to the extent to which users are using a tool. Once the tool is deployed, the next hurdle companies face is getting their users to make use of it. Tools often fail to gain popularity among end users because of complicated interfaces and slow query response times. The prevalence of other legacy applications also presents a major impediment to the adoption of new tools among end users.
The combination of these adoption and use rates provides criteria to measure and evaluate the usability of information management tools (1). It becomes imperative that information management tools be designed taking user requirements into account so that desired rates can be achieved.
From the Ground Up
Building an effective information management solution requires understanding an organization’s data and information landscape. An important aspect of that is related to understanding key business processes and systems for the information management solution. That requires three phases of activity (Figure 1): determining user requirements, establishing architectural goals, and defining the design space.
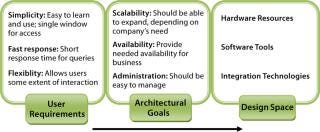
Figure 1: ()
Determine User Requirements: The successful design of an information management system depends on deep understanding of processes and systems within an organization. Most software solutions come bundled with many features that never get used to their fullest extent because they fail to engage users. What matters most to end users is an easy path to the correct information — rather than large numbers of features and their related learning curve. On that basis, the main end-user requirements can be explained as simplicity, fast response, and flexibility.
Simplicity: Any solution that presents a simple interface easily becomes popular among end users. Both the Gmail service (http://mail.google.com) and Google search (www.google.com) are classic examples that easily gained good adoption and use rates because they are easy to use. The more complex an interface, the more time it takes for users to learn it, so the more reluctant they become toward adopting that new solution or technology.
For example, an information management system should present a single window for access to its various data sources. The various components should integrate well into one unified platform that serves as a gateway for end users to reach all data sources. Otherwise, it becomes cumbersome and time consuming to collect information from different places.
Fast Response: A data management system should respond quickly to user queries. It should be able to fetch information from different sources and present it in a unified and timely form so end users don’t have to wait for queries to execute and results to load.
Flexibility: The system’s design should be as flexible as possible to serve different types of users. Some users like to drill down and interact and thus won’t be satisfied with merely static content. Such users should be allowed some level of interactivity with their results.
Establish Architectural Goals: Once process and data systems are understood, the next step is to establish architectural goals that translate processes into business goals and define the principles and philosophies behind infrastructure design. These form a basis for setting up criteria to evaluate a technological solution in terms of those business goals (typically scalability, availability, and administration).
Scalability: The entire architecture of an information-management solution should be designed to meet an organization’s scalability requirements. It should scale well according to the growing numbers and needs of the company, but at the same time should not be an exaggerated case that’s never fully leveraged. One way to bring scalability into a design can be to make it more modular so components can be added/removed as requirements change. Adopting open standards helps companies improve scalability of their data management systems.
Determine Availability: A company’s system architecture should meet its availability requirements so as to prevent business and productivity losses from unexpected downtimes and failures. The IT infrastructure should be fault tolerant enough to prevent single points of failure — but that always comes at a price. Each organization should seek understanding of how much downtime is acceptable without causing too much loss.
Administration: The complexity and sophistication of a system’s architectural backbone can make it difficult to manage. More may have to be spent on resources and manpower just to administer it. How much cost a company can incur on administering its data management system is something that should be considered at the design stage.
Define Design Space: The deep understanding of processes and systems (user requirements) and architectural goals set the stage for the next phase, in which a technology’s design space gets defined. This maps the requirements along with the technology to provide the most effective and efficient solution possible. Otherwise, adopting and adapting the tools and technology can be a challenge.
The design space consists of three components. Hardware forms the backbone to which applications will be deployed and should be fault tolerant, redundant, scalable, and compatible with those applications. Suitable software tools and technology must fulfill both the business and user requirements. And technologies are needed for integrating a range of sources into one unified platform.
The Biopharmaceutical Data Space
Mainly two types of information constitute the biopharmaceutical data space: structured and unstructured data. Structured data primarily present as numerical operational/transactional information typically stored in databases, spreadsheets, or data historians. Examples include streaming data from process and analytical equipments, noncontinuous sampling data, and analytical test results. Unstructured data usually come in the form of free text, Microsoft Word documents, and Microsoft PowerPoint presentations. These documents mainly relate to the manufacturing and development process of biopharmaceuticals: e.g., standard operating procedures (SOPs), development reports, and technical investigations. They are typically stored in shared drives or document management repositories.
Figure 2 explains the hierarchy of the biopharmaceutical knowledge space made up of structured and unstructured data and shows how workers typically process raw information into knowledge for better process understanding. As shown, raw data typically traverse through three layers as data, information, and knowledge. Crude numbers become useful knowledge as they are associated with underlying concepts and relationships. During the conversion from data into knowledge, the information becomes more and more unstructured because it loses its fixed schema of rows and columns to a loosely defined structure more understandable by humans but alien and difficult for machines to interpret. So programming unstructured data and knowledge is difficult.
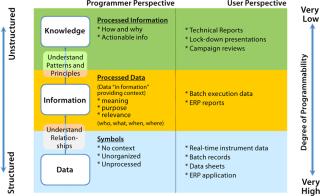
Figure 2: ()
Traditional Environment: In traditional biopharmaceutical environments, most data (except some manually recorded data points) simply remain at the source location where they’re generated (e.g., equipment data) and never reaches a larger audience. Problems arise when a few batches fail to meet specifications, and suddenly everybody needs to look at the data and figure out what went wrong. That triggers the activity of collecting pieces of information from various locations and compiling them to complete a whole picture. Companies can waste useful work hours just to gather data that was never managed properly.
As Figure 3 illustrates, a traditional biopharmaceutical data space comprises isolated silos of information that cannot communicate with one another. There’s no easy way to reach the data. These inefficiencies in traditional systems call for an integrated information management platform that can provide online availability of information, a complete picture of the process at various stages, real-time trends, and powerful search capability to make finding information easy.
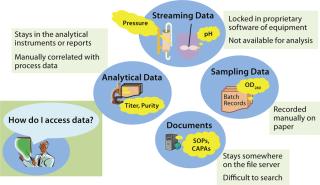
Figure 3: ()
An Information Management Platform
Creating an information management platform requires selecting the right tools for capturing data and making information available in a required format. Such tools can be selected according to the type of data to be captured. As Figure 4 shows, different types of tools are available to capture different kinds of data. Whereas structured data are handled by various data-mining tools, the unstructured space consists of “Web 2.0” technologies.
Although the kinds of data and tools for the structured and unstructured spaces differ, they are not independent of each other. In fact, the two types of data complement one another. Analysis of structured data creates new knowledge that mostly gets captured as unstructured data. In turn, unstructured information provides context for structured data, which otherwise is irrelevant without the context of underlying patterns and concepts. This relationship makes it important for tools chosen to handle these two types of information to be capable of communicating with each other. That way, both context and analysis will be seamlessly available to end users with both components intact.
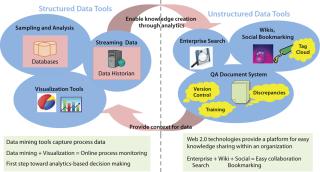
Figure 4: ()
Structured Data Tools
Mentioned below are some structured data tools that every company in biopharmaceuticals should have. These will help such organizations build their own efficient information infrastructures.
Data Historian: The huge amount of real-time data churned out by process equipment at every step of manufacturing makes it difficult for ordinary databases to store such information efficiently. Data historian programs provide the most suitable solution by running special compression algorithms that cut down storage space requirements while improving visibility through real-time data trends.
Two main products available in this category are OSIsoft’s PI-System software (www.osisoft.com) and the Aspen InfoPlus.21 program from ASPEN Inc. (www.aspeninc.com). Both products are equally competent, but the biopharmaceutical space is currently dominated by the OSIsoft product, which is now a standard data historian for reasons mentioned in Table 1. A new PI add-on product available from an OSI partner is the Zooms tool from Zymergi, Inc. (www.zymergi.com/zooms). It exposes PI tags on a company’s intranet using a Google-type search on a Web browser. They help knowledge workers focus on specific information and search data using a common process vocabulary.
Table 1: The PI and Aspen InfoPlus comparison
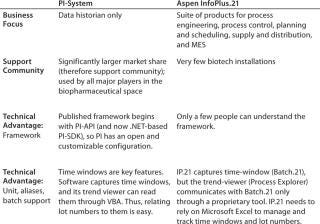
Table 1: The PI and Aspen InfoPlus comparison ()
Databases: Apart from real-time equipment data, biomanufacturing deals with many at-line sampling and off-line analytical data. Web forms can capture such information and post it to a back-end database, which becomes the repository of all manual data entries. Queries can be generated to retrieve information from a database and present it in a required format. A wide range of database engines are available, ranging from free open-source applications such as MySQL (www.mysql.com) and commercial programs such as Microsoft SQL (www.microsoft.com) and Oracle (www.oracle.com) products. Companies can decide which type of database they require based on features and affordability. The MySQL program is a good first choice that offers an option to migrate to more expensive options later as requirements scale up and demand for reliability increases.
Visualization Tools: Capturing data is the first step toward building an information management platform. To explore further, special tools can arrange data in various patterns so users can elucidate hidden relationships among variables and view trends. Data visualization tools represent information in a graphical/visual format.
For example, timeline data visualization displays time-based events across an organization. As Figure 5 shows, such a tool can be used to record the series of events that happen during batch processing in biopharmaceutical manufacturing. The Simile widget (www.simile-widgets.org/timeline) and the xTimeline program (www.xtimeline.com/timeline) are two such tools.
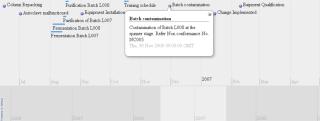
Figure 5: ()
Treemaps display hierarchical information and categorize information based on relationships. Treemap shapes, sizes, and colors can be used to represent different parameters and their inherent values for displays in which continuous monitoring is needed for complex activities. For example, in a biopharmaceutical setting treemaps can be configured on Web pages where all batch parameters related to a product are displayed and categorized based on process steps. Colors can be configured for upper and lower limits of each parameter to provide a real-time snapshot view of the whole process. Some leading treemap vendors are Panopticon (www.panopticon.com), Hive group (www.hivegroup.com), and SAS (www.jmp.com). The treemap in Figure 6 (generated using JMP software from SAS) compares product titers A, B, C, D, and E for batches (L001 to L110) colored according to each.
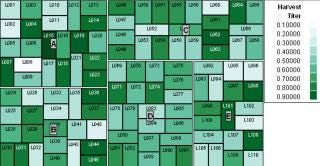
Figure 6: ()
As illustrated by a recent BioProcess International wall chart, bubble charts are powerful tools that display multidimensional data (2). X and Y axes can be set for different variables (molecular weight and year of product approval on the poster), and bubble size and color can be used to bring other variables into the picture (expression system and sales figures on the poster) (2). Relationships among variables are thus visualized by means of a single chart. The JMP program has one of the best bubble-chart visualization tools, with many drill-down and interactive features. Some Web-based charting tools from companies such as amCharts (www.amcharts.com) and InfoSoft Global Private Ltd. (www.fusioncharts.com) also have bubble-chart visualization capability. Figure 7 shows a JMP-generated bubble chart comparing cell count with culture age for different batches (L001 to L005) sized by culture titer.
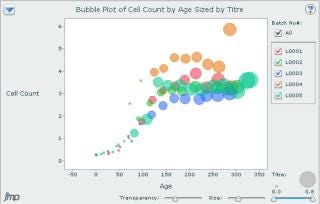
Figure 7: ()
Time plots plot time-series data with overlaid time-based events. These can be particularly useful for, e.g., overlaying bioreactor real-time trends (such as dissolved oxygen and pH) with at-line cell counts and viability data. The Timeplot program from Simile Project (www.simile-widgets.org/timeplot) provides one of the best ways to represent such information. Both the amCharts (www.amcharts.com/xy/time-plot) and Zooms (www.zymergi.com/zooms) programs also generate time plots. The plot in Figure 8 was generated using a Zooms search.

Figure 8: ()
Figure 9 summarizes our suggested tools to help bridge the gap between biopharmaceutical data capture and retrieval. Some of the visualization tools mentioned are Web-browser–based to help knowledge workers quickly perform analyses, then collaborate and share their results.
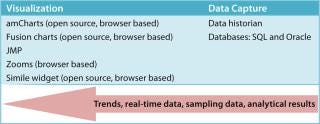
Figure 9: ()
The conclusion of this two-part article is dedicated to unstructured data capture and analytics. In Part 2 we will focus on how an integrated environment can be created to leverage both structured and unstructured data, providing a single access window to enterprise information for end users.
REFERENCES
1.) Eckerson, WW. 2008. Techniques and Technologies to Deploy BI on an Enterprise Scale. TDWI Best Practices Report www.tdwi.org.
2.) Scott, C. 2009. 30 Years of US-Approved Recombinant Cell Culture Products. BioProcess Int. supplement 7.
You May Also Like


