Comparability Protocols for Biotechnological ProductsComparability Protocols for Biotechnological Products
Comparability has become a routine exercise throughout the life cycle of biotechnological products. According to ICH Q5E, a comparability exercise should provide analytical evidence that a product has highly similar quality attributes before and after manufacturing process changes, with no adverse impact on safety or efficacy, including immunogenicity (1). Any doubt about data from such studies could translate into unforeseen pharmacological or nonclinical studies — or worse, clinical studies.
Selection of analytical methods and acceptance criteria that will be applied to demonstrate comparability can be the most difficult step in a comparability exercise. Defining where and how to begin is a time-saving approach to reduce the risk of not meeting deadlines. For that reason, we formalized a stepwise process aimed at expediting timelines while ensuring regulatory acceptance of our resulting comparability protocol.
The proposed process described here takes into consideration requirements of ICH Q5E, Q8, and Q9 guidances as well as the US Food and Drug Administration’s (FDA) points to consider for monoclonal antibody (MAb) manufacturing document and testing comparability protocol guidance (1,2,3,4,5). We tested our methodology with regulatory authorities by submitting our comparability protocols to both the FDA and the European Medicines Agency (EMA). Knowledge collected is transcribed here with the hope that it could benefit everybody working in biotechnology product development.
PRODUCT FOCUS: ALL BIOTECHNOLOGICAL PRODUCTS
PROCESS FOCUS: MANUFACTURING
WHO SHOULD READ: PROCESS DEVELOPMENT, ANALYTICAL, REGULATORY AFFAIRS, AND QA/QC
KEYWORDS: CHARACTERIZATION, PROCESS OPTIMIZATION, SCALE-UP, RISK, PRODUCT QUALITY ATTRIBUTES, ANALYTICAL METHODS
LEVEL: INTERMEDIATE
Principles of Comparability
The goal of a comparability exercise is to ascertain whether any quality attributes of a product have been affected by a manufacturing change. This helps a company evaluate possible impacts on safety and/or efficacy. Ideally, a thorough analytical comparison of product made before and after the change would detect no difference in its quality attributes, so there would be no need for further discussion. That is quite unlikely, however, and actually not so desirable.
It is well known that biotechnology products are highly complex and process-defined (“the product is the process” still applies). Any process change can be expected to affect such a product. A well-built analytical comparability exercise thus should be able to detect at least some discrete differences in selected quality attributes. Regulators expect comparability testing to bring to light some differences. So the key question is, in fact, whether those differences will have a negative impact on safety and/or efficacy?
To get there, it is important to be prepared and to carefully plan your analyses carefully. A cornerstone of thecomparability guideline involves predefined acceptance criteria, requiring an analytical testing plan to be finalized before testing postchange batches (1). Consequently, to get a comparability protocol formally released on time, drafting should be initiated about six months before manufacture of new batch(es). The protocol should describe all process changes, assess their effects on the product, define all planned analyses along with their acceptance criteria, describe stability studies (if any), and include all available supportive data.
Once results from all planned analyses are available, you can discuss the impact of process changes detected on your product. Your conclusions will be included in a comparability report together with results of your predefined studies. Depending on the outcome of that assessment, additional nonclinical or clinical “bridging” studies may have to be launched. Figure 1 summarizes the possible outcomes of comparability testing, with a progression from analytical to in vivo work. The type of studies that will be required is defined case by case depending on what product characteristics have been affected. Complete illumination of those effects and associated studies is outside the scope of our discussion.
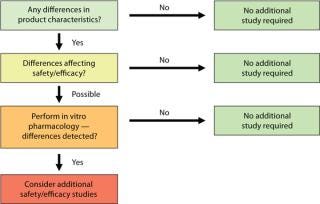
Figure 1: ()
Overall Strategy
Analytical comparability is the foundation of all comparability exercises. Depending on the extent of process change(s), it might even be sufficient to demonstrate comparability alone. Usually little time passes between the decision to go with an optimized process and manufacturing the first batch with the resulting process. A comparability exercise must fit into the narrow window between description of the process change(s) and getting new product in hand.
To begin, gather all relevant information relative to batches that have been previously manufactured. Prepare a list of product quality attributes (PQAs) to use as the basis for your impact assessment. With all that information compiled, the project team can decide which PQA(s) should be investigated depending on the type(s) of change made and the relevant method for such investigation(s). For a brand new process, most (if not all) PQAs would have to be assessed. With a list of tests in hand, you can define your acceptance criteria. Then design supportive stability studies if they will be needed. Each of the steps in Figure 2 is discussed in more detail below.
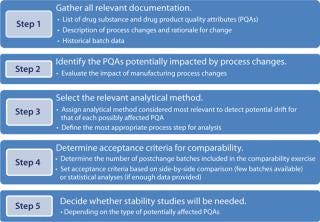
Figure 2: ()
Step 1 — Prerequisites: A successful comparability exercise depends on product knowledge accumulated during development. It is essential to have a comprehensive product profile with which to begin. Usually a list of p
roduct quality attributes (PQAs) is established early in development and periodically revised while data accumulates over time (2). That list will constitute the basis of your impact assessment following process changes (1). Quality attributes are mentioned in ICH Q6B as the basis for setting specifications (6) and further defined as “critical” (CQA) by ICH Q8 (2): “A physical, chemical, biological or microbiological property of characteristics that should be within an appropriate limit, range, or distribution to ensure the desired product quality.” Defining PQAs is now considered mandatory for pharmaceutical development of a biotechnological product (7, 8), and will be soon applicable to chemical entities as well (9).
Before starting a comparability exercise, you will need certain documentation: a list of PQAs, description(s) of process change(s), and historical batch-release and product characterization data.
A list of PQAs should have been established early for all products in development. The criticality of each quality attribute is determined through a quality risk-management exercise (3). Describing drug-substance and drug-product attributes in separate sections of a document can be useful so that changes related to the drug-product process only can be assessed easily. A criticality assessment of PQAs is not formally required for comparability testing, but we believe that it is a good practice to manage both the list and the risk assessment in a common document.
Process Change Description(s): Include a flow chart presenting pre- and postchange processes side-by-side with their differences highlighted in your comparability protocol. Such informationis usually prepared by process development teams as a rationale for proposed process changes and how they relate to manufacturing objectives. Discuss the impact of those changes on downstream process steps and overall product quality together with their possible effects on in-process controls that are already in place. That information will provide a basis for the impact assessment you will conduct later as well as for determining which process step is most suitable for evaluating a quality change.
Historical Data: All available information gathered for previously manufactured batches should be tabulated for inclusion as an annex to your comparability protocol. Include both batch-release and characterization data, as well as process validation data if available. Batches included in these tables should represent the previous process; you don’t need to include data from rejected batches or process-development studies.
Step 2 —PQAs and CQAs: A manufacturer may want to change a PQA for a good reason (e.g., when adapting a product formulation for a different patient population). In such cases, affected product attributes aren’t expected to be comparable after the change is made, so potential impacts on safety/efficacy must be discussed, possibly involving additional preclinical studies. In most cases, however, changes are introduced through process optimization during product development, and it is expected that such changes will not affect PQAs. That assumption must be demonstrated through analytical comparability testing.
Quality attributes are not automatically affected by one change or even several changes. For example, it may not be scientifically sound to assess the impact of changes to diafiltration parameters on the primary sequence of a MAb. Such testing would be relevant only for a change related to the expression system. Therefore you need to carry out an impact assessment exercise to define potentially affected PQAs in relation to each process change. Starting from the list of process changes prepared in Step 1, you can determine which PQA(s) would be potentially affected by any given change.
Table 1 offers a proposed template for conducting such an exercise, applying it to a case study involving scale-up of a MAb upstream process. This template should be filled in very carefully during a team meeting with representatives of all groups involved in product development (analytical, process development, nonclinical, and regulatory).
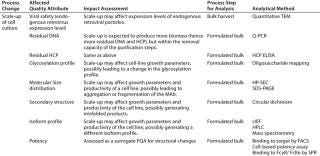
List process changes in the first column. Assessing one change after another, you can list potentially affected PQAs in the second column, with short summaries of their rationales in adjacent cells. During the meeting, some PQAs may be identified as potentially affected by different process changes. It is useful, however, to report those in each place to demonstrate that all possible outcomes have been explored by the team. You can eliminate duplications when constructing a final testing plan.

Figure 2:
Defining the Most Appropriate Process Intermediate for Analysis: The next action is to determine what would be the most relevant step for each analysis. Take into consideration both the likelihood of detecting a change and the availability or sensitivity of relevant analytical tools. Theoretically, a change should be assessed at the next process step downstream of the process modification. In practice, most testing is performed at the drug substance stage, partly because sensitivity requirements make it necessary to perform several different analyses on purified molecules. Furthermore, when studying impurities, it makes sense to analyze a product once it has been fully purified because downstream steps should have removed excess impurities generated upstream. If it is less pure when tested at the bulk harvest stage, a product may yet end up comparable after having gone through its entire purification scheme.
The process step selected for analysis is reported in the fourth column of the impact-assessment template. In some cases the analysis will have to be performed on the drug product as well if a change to the drug substance manufacturing process can be predicted to have an impact on the drug product.
Step 3 — Analytical Methods: The last column of the impact assessmenttemplate is assigned to identification of an analytical method considered to be the most relevant for detecting a potential change in the corresponding quality attribute. Such a method is best selected from the panel used for product characterization or release, for which some historical data will already be available for comparison. A general strategy is to analyze postchange batches compared with existing reference standard(s) and results from prechange batches. When a new analytical method is implemented for a particular attribute, with no data previously generated, adirect side-by-side comparison of p
rechange and postchange products must be performed.
To establish objective acceptance criteria, selected methods should be quantitative whenever possible. Capillary electrophoresis and capillary isoelectric focusing (cIEF) are typically preferred over regular electrophoretic methods. And use of orthogonal methods is encouraged, especially for those quality attributes that can affect product function (e.g., higher-order structure and glycosylation profile).
Use the same reference standard for comparability studies as for other analytical testing, typically an existing prechange reference standard. When necessary, a postchange reference standards will have to be appropriately qualified for future use after your comparability study has demonstrated acceptable comparability.

Figure 2: ()
Step 4 — Acceptance Criteria: Assessing comparability requires more than merely applying the analytical testing program used for routine batches. Although a postchange product must comply with previously defined specifications, that alone cannot be taken as a demonstration of comparability. It is quite possible (and actually not so rare) that such a product could not be comparable to prechange product but still fit within specifications. Your comparability exercise should focus only on relevant PQAs, and your comparability acceptance criteria should be based on trend analyses, whereas specifications are based mainly on clinical use of a given product (10). For example, a purification process change might induce a significantly higher amount of endotoxin that remains within the approved endotoxin limit for the final product. The effect of that process change on the “endotoxin content” quality attribute should be acknowledged. Fortunately, in that case, an absence of consequences on patient safety would be easy to justify.
For some quality attributes — such as process-related impurities — demonstrating that their amounts are reduced to levels considered to be “state-of-the-art” is actually most important. A trend analysis approach may not be possible, so acceptance criteria should be established at limits that would beexpected at the corresponding stage of development.
Setting Acceptance Criteria for Late-Stage Development: To accumulate as much data as possible for trend analysis, include all batches considered to be representative of the prechange process in your comparability study. Those data will be used to set acceptance criteria for comparability, and a large number of batches will best describe the inherent variability of your process.
You can base the acceptance criteria for quantitative parameters on a standard deviation (SD) calculated from those historical data — provided that enough are available for statistics. A range corresponding to the mean ± 2 SD would include 95% of batches and can be used to detect outliers. Note that a range based on 3 SD, which is sometimes used for release specifications, would include virtually all batches (99%); regulators would view that as too permissive for comparability assessment.
Depending on their extent, for changes made when preparing phase 3 clinical batches, a minimum of two postchange batches would need to be compared with historical data. For marketed products, three postchange batches (usually corresponding to validation batches), are compared to those data from a previous process.
Setting Acceptance Criteria at an Early Stage: When comparability testing is required during early development phases, typically only one prechange batch is compared with a single postchange batch. Engineering runs can be used to complete those data, representing the prechange, postchange, or both batches. That small amount of data does not allow for acceptance criteria that would truly reflect process capability or product-acceptable variation. In such a case, prespecified acceptance criteria may be unsuitable.
Alternatively, you could establish predefined limits based on previous knowledge and published data, which would trigger a risk assessment if the limit is met. Instead of relying on acceptance criteria, then comparability would be better judged from direct, side-by-side comparison of data from products made using both processes analyzed simultaneously. So it is essential to store retention samples from different process stages during development so that you can rerun analyses at a later time. Detectable differences beyond predefined limits should be discussed and their possible impact on safety and efficacy evaluated. For example, an acceptable difference in mass determined using mass spectrometry (MS) could be established on the basis of instrument variability documented by the manufacturer.
Assembling a list of potentially affected quality attributes with methods selected for their analysis and the corresponding acceptance criteria constitutes the analytical panel of a comparability exercise as in Table 2.
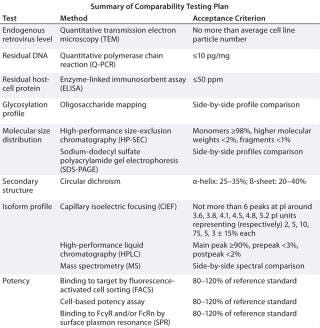
Step 5 — Stability Studies: According to the ICH Q5E guideline, stability studies are not mandatory for a comparability exercise (1). Such studies should be performed if a change might affect either protein structure or purity/impurity profiles. In practice, most changes to a biomanufacturing process could alter protein structure and purity, so regulators will request stability studies in most cases. In just a few instances an absence ofstability studies may be acceptable with a strong rationale supporting a lack of impact on structure and purity. Such studies may be unnecessary for minor changes in a well-controlled step, as well.
When important changes are applied to a bioprocess, usually before the launch of a new clinical trial, at least one batch is run through a stability program to demonstrate that the stability profile remains similar to that previously established. Such studies are performed under long-term and accelerated conditions, so conclusive data on stability may be generated only after finalization of a comparability report. To fulfill the requirements for comparability, regulators strongly recommend performing forced-degradation studies. When stability is deemed necessary, a side-by-side study protocol comparing material manufactured using the new process with that manufactured by the original process should be part of the comparability protocol. Include those results in the discussion about comparability in your final report.
Some changes to a drug-substance manufacturing process may affect the drug product. In such cases, you should consider
a stability study dedicated to the drug product.
Step By Step
We designed a stepwise methodology for conducting comparability exercises to expedite drafting comparability protocols during biotechnological product development. We hope our methodological considerations and examples will help clarify the requirements of regulators for this work.
This represents just half of the journey, the second part of which is preparation of the comparability report. It summarizes the results from an analytical comparability study as predefined in the comparability protocol and carries theimpact assessment on safety and efficacy for all PQAs that were altered by the process changes. That is very much a case-by-case exercise that is not as amenable to standardization as is the protocol.
Comparability in the BPI Archives
For more discussion of comparability in general, be sure to take a look at the “Biosimiliars for the Real World” supplement polybagged with this issue. And here are some valuable past articles from our online archives.
Manzi AE. Carbohydrates and Their Analysis, Part One: Carbohydrate Chemistry. BioProcess Int. 6(2) 2008: 54–60.
Towns J, Webber K. Demonstrating Comparability for Well-Characterized Biotechnology Products. BioProcess Int. 6(2) 2008: 32–43.
Julien C, Whitford W. The Biopharmaceutical Industry’s New Operating Paradigm. BioProcess Int. 6(3) 2008: S6–S14.
Manzi AE. Carbohydrates and Their Analysis, Part Two: Glycoprotein Characterization. BioProcess Int. 6(3) 2008: 50–57.
Robinson CJ, Little LE. Wallny H-J. Bioassay Survey 2006–2007. BioProcess Int. 6(3) 2008: 38–48.
Seamans TC, et al. Cell Cultivation Process Transfer and Scale-Up in Support of Production of Early Clinical Supplies of an Anti IGF-1R Antibody, Part 1. BioProcess Int. 6(3) 2008, pp. 26–36.
Seamans TC, et al. Cell Cultivation Process Transfer and Scale-Up in Support of Production of Early Clinical Supplies of an Anti IGF-1R Antibody, Part 2. BioProcess Int. 6(4) 2008: 34–42.
Krishnamurthy R, et al. Emerging Analytical Technologies for Biotherapeutics Development. BioProcess Int. 6(5) 2008: 32–42.
Manzi AE. Carbohydrates and Their Analysis, Part Three: Sensitive Markers and Tools for Bioprocess Monitoring. BioProcess Int. 6(6) 2008: 54–65.
Bierau H, et al. Higher-Order Structure Comparison of Proteins Derived from Different Clones or Processes. BioProcess Int. 6(8) 2008: 52–59.
Das RG, Robinson CJ. Assessing Nonparallelism in Bioassays. BioProcess Int. 6(10) 2008: 46–56.
Zabrecky JR. Why Do So Many Biopharmaceuticals Fail? BioProcess Int. 6(11) 2008: 26–33.
Mire-Sluis A, et al. Quality by Design: The Next Phase. BioProcess Int. 7(1) 2009: 34–42.
Anicetti V. Biopharmaceutical Processes: A Glance into the 21st Century. BioProcess Int. 7(2) 2009: S4–S11.
Brown DB, et al. Assay Validation for Rapid Detection of Mycoplasma Contamination. BioProcess Int. 7(4) 2009: 30–40.
Ball P, Brown C, Lindström K. 21st Century Vaccine Manufacturing. BioProcess Int. 7(4) 2009: 18–28.
Beck G, et al. Raw Material Control Strategies for Bioprocesses. BioProcess Int. 7(8) 2009: 18–33.
Toro A, et al. Changes in Raw Material Sources from Suppliers. BioProcess Int. 8(4) 2010: 50–55.
Rieder N, et al. The Roles of Bioactivity Assays in Lot Release and Stability Testing. BioProcess Int. 8(6) 2010: 33–42.
Seymour P, Jones SD, Levine HL. Technology Transfer of CMC Activities for MAb Manufacturing. BioProcess Int. 8(6) 2010: S46–S50.
Nixon L, Rudge S. Technology Transfer Challenges for In-Licensed Biopharmaceuticals. BioProcess Int. 8(10) 2010: 10–18.
Wei Z, et al. The Role of Higher-Order Structure in Defining Biopharmaceutical Quality. BioProcess Int. 9(4) 2011: 58–66.
Siemiatkoski J, et al. Glycosylation of Therapeutic Proteins. BioProcess Int. 9(6) 2011: 48–53.
Langer ES. Limited Analytical Technologies Are Inhibiting Industry Growth. BioProcess Int. 9(9) 2011: 18–23.
Mire-Sluis A, et al. Analysis and Immunogenic Potential of Aggregates and Particles. BioProcess Int. 9(10) 2011: 38–47.
Schilling BM, Abu-Absi S, Thompson P. Metabolic Process Engineering. BioProcess Int. 10(1) 2012: 42–49.
Whitford WG. Single-Use Technology Supports Follow-On Biologics. BioProcess Int. 10(5) 2012: S20–S31.
Kozlowski S, et al. QbD for Biologics. BioProcess Int. 10(8) 2012: 18–29.
Klinger C, et al. Enhancing Data Quality with a Partly Controllable System at Shake Flask Scale. BioProcess Int. 10(9) 2012: 68–72.
Mire-Sluis A, Kutza J, Frazier-Jessen M. Rapid Pharmaceutical Product Development. BioProcess Int. 10(11) 2012: 12–21.
Mire-Sluis A, et al. Drug Products for Biological Medicines. BioProcess Int. 11(4) 2013: 48–62.
We believe, however, that a solid rationale for the analytical part of the comparability exercise — based on impact assessment from the process changes — will be a major asset in the overall comparability process. That makes it worth every effort to develop the best comparability protocol.
About the Author
Author Details
Mélanie Schlegel is regulatory project manager at LFB Biotechnologies in Les Ulis, France. Corresponding author Dr. Yves Bobinnec is senior regulatory affairs manager at DBV Technologies, 80/84 rue des Meuniers, 92 220 Bagneux, France; [email protected].
REFERENCES
1.) ICH Q5E 2005. Comparability of Biotechnological/Biological Products Subject to Changes in Their Manufacturing Process. US Fed. Reg. www.ich.org/fileadmin/Public_Web_Site/ICH_Products/Guidelines/Quality/Q5E/Step4/Q5E_Guideline.pdf 70:37861-37862.
2.) ICH Q8(R2) 2009. Pharmaceutical Development. US Fed. Reg. www.ich.org/fileadmin/Public_Web_Site/ICH_Products/Guidelines/Quality/Q8_R1/Step4/Q8_R2_Guideline.pdf 71:98.
3.) ICH Q9 2006. Quality Risk Management. US Fed. Reg. www.ich.org/fileadmin/Public_Web_Site/ICH_Products/Guidelines/Quality/Q9/Step4/Q9_Guideline.pdf 71:32105-32106.
4.) CBER 1997. Points to Consider in the Manufacturing and Testing of Monoclonal Antibody Products for Human Use, US Food and Drug Administration, Rockville.
5.) CBER/CDER/CVM 2003. Guidance for Industry Comparability Protocols: Protein Drug Products and Biological Products — Chemistry, Manufacturing, and Controls Information, US Food and Drug Administration, Rockville.
6.) ICH Q6B 1999. Test Procedures and Acceptance Criteria for Biotechnological/Biological Products. US Fed. Reg. www.ich.org/fileadmin/Public_Web_Site/ICH_Products
/Guidelines/Quality/Q6B/Step4/Q6B_Guideline.pdf 64:44928.
7.) EMA/CHMP/BWP/534898/2008 2008.Guideline on the Requirements for Quality Documentation Concerning Biological Medicinal Products in Clinical Trials, European Medicines Agency, London.
8.) Bobinnec, Y, and F Rossi. 2011. Review of the New EMA Draft Guideline: Setting the Quality Requirements for Biotechnological IMPDs. Reg. Rapport. 8:25-27.
9.) ICH Q11 2012. Guideline on Development and Manufacture of Drug Substances (Chemical Entities and Biotechnological/Biological Entities). US Fed. Reg. www.ich.org/fileadmin/Public_Web_Site/ICH_Products/Guidelines/Quality/Q11/Q11_Step_4.pdf 77:69634-69635.
10.) EMA/CHMP/BWP/30584/2012 2012.Report on the Expert Workshop on Setting Specifications for Biotech Products (EMA, London, 9 September 2011), European Medicines Agency, London.
You May Also Like


