“Combine All Files” Maps“Combine All Files” Maps
Many proteins are regulated by posttranslational modifications (PTMs) such as deamidation, phosphorylation, and glycosylation. Documented effects of PTMs include changes in enzymatic activity, interactions with other proteins, subcellular localization, and targeted degradation (1, 2). Also these physicochemical modifications may also affect receptor binding (3) or higher order structure (4) and result in clinical effects such as changes to bioactivity, immunogenicity, and bioavailability (5). The development of analytical technologies to rapidly interrogate protein structure also has direct relevance to the biopharmaceutical industry because protein production processes can significantly affect a protein product’s PTMs and higher order structure (6, 7). Such changes may have an impact on the ratio of different subpopulations of a protein product and hence alter the safety and efficacy profile of a biopharmaceutical. Easy identification of protein characteristics may facilitate engineering in desired characteristics during process development.
PRODUCT FOCUS: PROTEINS, PEPTIDES
PROCESS FOCUS: PRODUCTION, PROTEIN CHARACTERIZATION
WHO SHOULD READ: PRODUCTION PERSONNEL, PROCESS DEVELOPMENT
KEYWORDS: POSTTRANSLATIONAL PROCESSING, CHARACTERIZATION, CAF MAPS, LC-MS, HPLC, RP-HPLC, UPLC, SIGNAL-TO-NOISE-RATIO
LEVEL: INTERMEDIATE
Consequently, there is both scientific and commercial interest in more rapid and sensitive methods for protein analysis. Furthermore, regulatory authorities require measurement of product-related impurities in protein biopharmaceutical products that are introduced from processing or during storage (8). Some product-related impurities such as aggregation and truncation are routinely detected by well-established analytical techniques, whereas detecting some chemical modifications of amino acids may require more sophisticated techniques. For example, deamidation of an asparagine or glutamine residue to aspartate and glutamate, respectively, differs by a single Dalton on a single amino acid from the parent molecule. This poses a challenge in developing suitable analytical techniques to monitor the modification.
Peptide mapping by LC-MS is an established technique used routinely to confirm protein primary structures and to compare different production batches of a protein. However, limitations of this technique are linked to the sensitivity of both the liquid chromatography and mass spectrometry instruments, which do not always enable detection and identification of trace or minor components (9). As ion currents produced by molecular species approach the background noise level, due to either low concentration or low ionization potential, their detection by the classical LC-MS approach becomes increasingly difficult. Consequently, the signal-to-noise (S/N) level of a mass spectrometer determines the ability of the instrument to unambiguously identify minor species.

Figure 1:
WWW.PHOTODISC.COM
One approach to overcoming the difficulty of detecting low-concentration species is to increase the injected sample volume. But the limitation in this case is sample saturation of the column. In addition, because of the very high concentration of some species in the sample, the major and/or most ionizable species can saturate the MS detector, limiting detection of trace amounts or those less prone to ionize (10).
Our original approach uses LC-MS data treated with an association of available Mass Lynx tools. This allows a combination of total ion currents (TICs) obtained from several injections of the same sample and accumulation of digitalized profiles obtained, according to mass-to-charge ratio (m/z) and retention times. This approach increases the S/N ratio, allowing detection of species in low amounts or that have low ionization potentials. Conversion of accumulated TICs into digitalized two-dimensional “Combine All Files” (2D CAF) maps (or 3D CAF maps if signal intensity is included) facilitates rapid resolution and detection of coeluting species in the chromatogram. Each 2D map is a unique fingerprint of the protein, in which each spot represents a detected species (see the “Materials and Methods” box).
Results
Increase in S/N Ratio By Using Combine All Files (CAF) Function: Several consecutive peptide maps were obtained by HPLC-MS from a single digestion of Protein 1. The TICs from the individual peptide maps were summed using the Mass Lynx “Combine All Files” (CAF) function. In Figure 1A, comparing one TIC with TICs from seven summations shows differences in the number of detected peaks. Specifically, no signal at 64.55 min or 66.10 min were observed with one TIC, whereas after the combination of seven TICs two distinct peaks are visible, allowing detection of two additional species in this part of the chromatographic profile (Figure 1B). Also, corresponding mass spectra at 66.10 min clearly demonstrate the increase in S/N ratio (Figure 1C). After one acquisition, the spectrum is not interpretable, whereas after seven summed acquisitions the spectrum can easily be interpreted and the masses of the species determined. The spectrum obtained after combination of seven TICs shows a mass of 7,961.57, which could be unequivocally identified as a nonoxidized tryptic peptide of protein A, compared with the spectrum from one TIC, which is extremely noisy. The peak at 64.55 min was identified as the oxidized form of the same tryptic peptide (spectra not shown). The summed TIC using CAF increased the real signals but not the random background noise, thus improving the S/N ratio.
MATERIALS AND METHODS
Sample Preparation: Protein 1 samples were digested by trypsin (modified sequencing grade cod 11502020 with an enzyme-substrate ratio, E/S, of 1/66) for four hours at 37 °C in 50-mM Tris HCl pH 7.5. Protein 2 samples were digested by AspN (Roche, www.roche.com) for four hours at 37 °C in 50-mM sodium phosphate buffer pH 7.8.
LC-MS Conditions and HPLC-UPLC Systems: Analyses on Protein A were performed on a Waters Alliance HPLC (Waters, Milford, USA, www.waters.com) equipped with a binary solvent delivery system, an autosampler, and a tunable UV detector. Separation was performed on a 250-mm × 2.1-mm, 5-µm i.d., 100 Å C18 endcapped column (supersphere, Merck, www.merck.com) eluted with a linear gradient from aqueous 0.1% TFA to 0.1% TFA in acetonitrile over 95 minutes at a flow rate of 200 µL/min. To partition the flow rate, a post-UV detector split was inserted so that in the ESI source the flow rate was of 100 µL/min. Analyses on Protein B were performed on a Waters UPLC instrument equipped with an autosampler and a tunable UV detector. Separation was performed on a 50-mm × 2.1-mm, 1.7-µm i.d., C18 column (Acquity, Waters) eluted with a linear gradient from aqueous 0.1% TFA to 0.1% TFA in acetonitrile over 25 minutes at a flow rate of 200 µL/min.
Mass Spectrometric System: Mass spectrometry was performed using a triple-quadrupole (Quattro II, Waters, Manchester, UK) and a single-quadrupole (ZQ, Waters, Manchester, UK) instruments, operating in positive ion electrospray mode. On the triple-quadrupole MS, the nebulization gas was set at 20 L/h, the drying gas at 350 L/h, and the source temperature set to 100 °C. On the single-quadrupole MS, the nebulization gas was set at 200 Ll/h, the drying gas at 300 L/h, and the source temperature set to 80 °C. For both instruments the capillary and cone voltages were set to 3,500 V and 35 V, respectively. The MS data were collected between 400 and 2,000 m/z with a scan time of 3.2 sec and an interscan time of 0.1 sec.
Data Interpretation: The data have been interpreted by the MassLynx 4.0 software (Waters, Manchester, UK). After MS acquisition, the TIC traces have been summed according to the Combine All File (CAF) function. The 2D maps have been produced by the map function tool available in MassLynx 4.0. Default parameters have been used for all presented data. Statistical interpretations of data have been performed using Statgraphics plus 4.0 software for the determination of the regression curve and linearity.
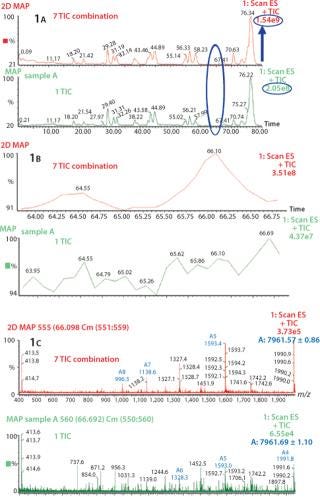
Figure 1: ()
Rapid Peptide Mapping By UPLC-MS: Classical peptide maps produced by reversed-phase HPLC (RP-HPLC) usually need quite long run times (>100min) to resolve digested peptides. This technology can provide reproducible peak retention times over these typically long runs. Ultra-performance liquid chromatography (UPLC) is reported to provide rapid chromatographic separations compared with HPLC (11). We evaluated this technique for rapid peptide mapping. In addition, we added an MS detector to the UPLC to verify compatibility of this new technology with CAF analysis. We digested protein 2 by Asp N and analyzed the resultant peptides by UPLC-MS. The peptide map run was completed in <20 min. This significantly shortened the peptide map run time compared with the established HPLC separation (over two hours), while retaining a comparable resolution. Nine consecutive UP-LC-MS runs were performed with the same protein B digest and summed by CAF. Depending on the properties of a peptide, there may be a sufficient ultraviolet (UV) signal for detection, but the peptide may be lost in the noise of the mass spectra through a poor ionization potential or low concentration.
In Figure 2, the comparison between the UV trace, one TIC, and nine summed TICs illustrates the sensitivity of the CAF approach. Several peaks obtained in the UV trace are not visible in the one TIC trace, suggesting that the peptides are either poorly ionizable or present in low concentrations. After combining nine TIC acquisitions, we detected several additional peaks present in the UV trace but not visible in the one TIC trace (Figure 2). Some new peaks detected in Figure 2A have been identified as miscleaved or nonalkylated peptides, glycosylated peptides, and/or deamidated peptides (peaks labeled from 1 to 4 in Figure 2A).
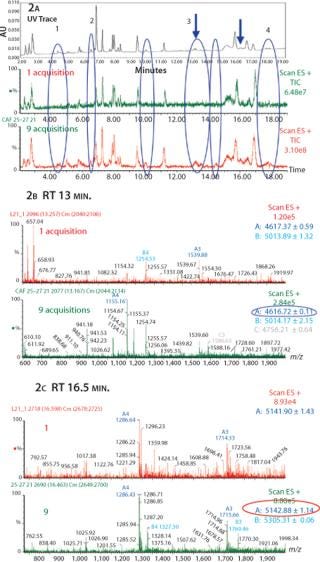
Figure 2: ()
Between 13.1 and 13.3 minutes under Peak 3 (as indicated by arrow), no peaks were detected in one TIC. However, after summation of nine TICs we detected a single peak, which we identified as a deamidated peptide in the combined spectra (Figure 2B). In Figure 2c, between 16.4 and 16.5 minutes (as indicated by arrow) we obtained a better resolved peak in the nine TIC compared to the one TIC. We were then able to clearly identify a glycosylated peptide (agalacto species fucosylated, G0F) on the corresponding nine TIC spectrum.
By combining UPLC and CAF, we have detected and identified additional PTMs, confirming the capacity of the software and its compatibility with UPLC data.
Comparison of Different Samples of the Same Protein By CAF: Samples of protein 1 produced on two different occasions (samples A and B) were analyzed by HPLC-MS. Each sample was analyzed three times, and the TICs from the three acquisitions were summed. After summation of three TICs, a new peak was observed in both samples (data not shown). The mass spectra under the peaks were compared for samples A and B after one TIC and after three TICs. Spectra from both samples after only one TIC are difficult to compare because of interference from background noise (Figure 3). Spectra after summation of three TICs were easier to compare and demonstrate the presence of the same species in both samples A and B (Figure 3).
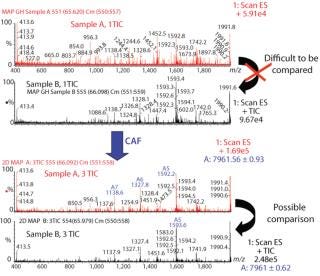
Figure 3: ()
CAF Linearity: To demonstrate that the relative abundance of a peptide is stable compared with other peptides after CAF treatment, it is necessary to show a linear ion current response as the TICs are accumulated. An AspN digest of protein 2 was analyzed by UPLC-MS with consecutive summation of the TICs over nine acquisitions. Ion current intensity of individual peaks was used to calculate linearity. A linearity curve with a correlation coefficient >0.99 was obtained for the peak at five minutes (chromatogram in Figure 2) and is shown in Figure 4. This correlation coefficient was confirmed for other peptides in the peptide map. Linearity is fully linked to the reproducibility of the HPLC and UPLC retention times.
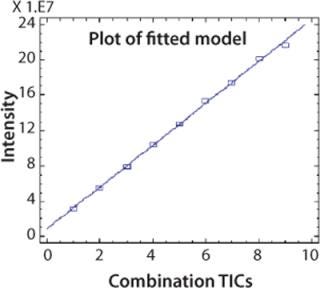
Figure 4: ()
2D (3D) CAF Maps Facilitate Protein Analysis: In Figure 5, nine TICs of the protein 2 peptide map have been summed using CAF and visualized as a 2D CAF map using MassLynx. The 2D visualization corresponds to a map with retention time (corresponding to hydrophobicity) along the X axis and m/z along the Y axis. Each detected peak is indicated on the map as a small colored spot. The color is linked to the intensity of the species. Even though the ionization potential of peptides may be different, the change in color of an individual spot relates to a change in the amount of that species. Consequently, the 2D CAF map can be considered to have a third dimension in which ionization intensity is monitored. Different thresholds can be applied to the 2D map to eliminate the artifact species corresponding to the residual noise not removed by CAF. Figure 5 shows 1%, 5%, and 10% thresholds. Interestingly, this 2D CAF map allows visualization of coeluting peptides (assuming the same retention time but different m/z). It is possible to identify each peptide spot similarly to identifying proteins in proteomic gels. However, current software cannot store the map coordinates or spot identification.
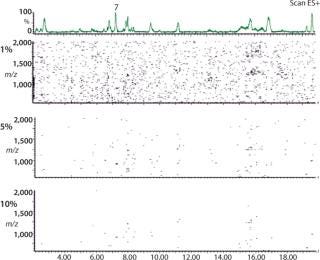
Figure 5: ()
Discussion
There is an increasing demand to understand protein characteristics from both a scientific and commercial perspective. These characteristics can cause fundamental changes to a biological and, in the case of biopharmaceuticals, to a molecule’s clinical activity. Current methods to interrogate these characteristics are often targeted to particular types of modifications of the native protein (e.g., glycosylation, oxidation). In early clinical phases of biopharmaceutical development, it is not always apparent to which modifications a molecule is most susceptible. Hence, monitoring and possible quantification are required.
The necessity to better interrogate the structure of proteins has led rapidly to the use of the analytical tools described here. The strategy of combining UPLC, CAF, and 2D maps enables resolution and identification of those peptide species (including PTMs) that can be resolved by mass or hydrophobicity and that are either poorly ionizable or present at low concentrations in the sample. This single approach can quickly identify those characteristics of a protein that may warrant further investigation or quantitation. Traditional peptide mapping can involve chromatography run times up to several hours long. That has a direct impact on the time required for protein characterization studies.
We have demonstrated that chromatography run times for peptide maps are significantly shorter using UPLC (about 20 mins) rather than traditional HPLC (usually 12 hours). The peak resolutions of peptide maps are comparable. Liquid chromatography followed by mass detection is a well established analytical tool. The TIC for each chromatographic run contains the combined files of the mass spectra gathered during the chromatographic run. In addition to the speed of the UPLC-MS compared with normal HPLC-MS, individual TICs from the separate chromatographic runs can be combined using CAF software.
The practical result of combining TICs is an increased S/N ratio allowing detection of species with poor ionization potential or that are present in low amounts. It also provides greater mass accuracy of identified peaks. CAF analysis is totally compatible with all HPLC techniques, as long as the chromatographic method has reproducible retention times. The shorter run times of UPLC also result in smaller memory files for TIC data, which facilitate CAF analysis. A reference CAF file for a protein can be produced containing all the identified PTMs. Compared with a single peptide map run, more sample is required for the several peptide maps needed to use CAF software. On the other hand, other techniques for detecting PTMs or impurities generally require high quantities or concentrations of protein because of instrument sensitivity (12).
In our experience, data acquisitions from several chromatographic runs of the same sample can offer some advantages over one injection of a large protein/peptide mixture. The high concentrations often needed for PTM analysis may require a concentration step, which can be a source of sample loss, particularly for trace amounts. Moreover, the intrinsic physicochemical properties of the molecule do not always allow high concentrations. To eliminate the concentration step, an alternative approach can be several injections on the column followed by one elution step, to concentrate the sample in the column.
However, injecting large amounts of material on a column can rapidly foul that column, affecting both resolution and detection. Indeed, it has been reported that column overload could contribute to significant signal suppression and affect the separation ability of the system (13, 14). Thus, signal suppression could occur and trace species will be less detectable. ESI process signal suppression effects have been reported extensively (15). Because of the high concentration of some peptides in a sample, the major and/or most ionizable by ESI-MS can saturate the detector, limiting their detection in trace amounts or making them more difficult to ionize. These signal suppression effects are believed to result from the competition of analyte ions for access to the droplet surface for gas phase emission.
The CAF approach is a powerful alternative to sample concentration methods for increasing the S/N ratio and allow detection of peptides in low amounts and/or that are poorly ionizable. Although the CAF software was developed several years ago, it has had limited use due to the processing power required to combine large MS files. Improvements in computer technology have significantly reduced this limitation.
In addition to the CAF approach, visualization of the TIC into a 2D CAF map is useful for LC-MS results. All detected species are located on the map as spots according their retention times (hydrophobicity in the case of peptide maps) and their m/z. The 2D representation of the CAF data, and also the use of the threshold level can ensure that each spot on the map is a real signal related to the sample of interest. The major advantage of this approach is the chance to detect rapidly co eluting species and/or the PTMs without artifact signals. The 2D CAF map (or 3D CAF map if the spot intensity is used) is a fingerprint of all the primary sequence and all PTMs detected by the LC-MS method.
Changes in protein characteristics that affect either hydrophobicity and/or m/z can cause changes in the 2D coordinates of the spots. It is a relatively simple process to compare spot coordinates of CAF maps of samples from different processes. The 2D CAF map of LC-MS data is similar to the 2D gels produced to resolve protein mixtures containing several hundred proteins. Proteomics software has been designed to analyze such gels facilitating both spot identification and comparison of maps. This type of 2D gel analysis should also be applicable to 2D peptide maps. The 2D peptide maps containing coordinates of peptide spots may be useful as a reference map of a protein. However, it should be noted that the current Mass Lynx 2D map software does not contain the analytical sophistication of 2D gel map software used for proteomics.
We are currently investigating the possibility of improving the 2D software to allow comparison of different peptide maps. This will facilitate improvements in process development and comparison of batch-to-batch production of proteins.
A Powerful Tool
The combination of the UPLC-MS data using the CAF approach and the visualization of the results by 2D CAF map creates a powerful tool for detection and characterization of posttranslational modifications (PTMs) or impurities. The following conclusions can be given according our results:
Rapid generation of 2D (or 3D) essentially noise-free protein fingerprints that resolve the peptides and PTMs by hydrophobicity and m/z
Higher mass accuracy of the detected species due to the increase of the S/N ratio
Improved detection of species present in either low amounts or having poor ionization potential.
REFERENCES
1.) Hunter, T. 1995. Protein Kinases and Phosphatases: The Yin and Yang of Protein Phosphorylation and Signaling. Cell 80:225-236.
2.) Delom, F, and E. Chevet. 2006. Phosphoprotein Analysis: From Proteins to Proteomes. Proteome Sci. 4:112.
3.) Cunningham, BC, and JA. Wells. 1993. Comparison of a Structural and a Functional Epitope. J. Mol. Biol. 234:554-563.
4.) Datola, A. 2007. Characterisation of a Novel Growth Hormone Variant Comprising a Thioether Link between Cys182 and Cys189. ChemMedChem 2:1181-1189.
5.) Brooks, SA. 2006. Protein Glycosylation in Diverse Cell Systems: Implications for Modification and Analysis of Recombinant Proteins. Expert Review Proteomics 3:345-359.
6.) Boerner, R, and K. Clouse. 2005. Defining Your Product Profile and Maintaining Control Over It, Part 3: Product-Related Impurities. BioProcess Int. 3:50-56.
7.) Chirino, AJ, and A. Mire-Sluis. 2004. Characterizing Biological Products and Assessing Comparability Following Manufacturing Changes. Nat. Biotechnol. 22:1383-1391.
8.) Lasdun, AM. 2001. Validatibility of a Capillary Isoelectric Focusing Method for Impurity Quantitation. J. Chromatog. A. 917:147-158.
9.) Garcia, BA, J Shabanowitz, and DF. Hunt. 2005. Analysis of Protein Phosphorylation By Mass Spectrometry. Methods 35:256-264.
10.) Enke, CG. 1997. A Predictive Model for Matrix and Analyte Effects in Electrospray Ionization of Singly-Charged Ionic Analytes. Anal. Chem. 69:48-85.
11.) De Villiers, A Evaluation of Ultra Performance Liquid Chromatography Part 1: Possibilities and Limitations. J. Chromatog. A.
12.) Deutzmann, R. 2004. Structural Characterization of Proteins and Peptides. Methods Mol. Med. 94:269-297.
13.) Choi, BK, DM Hercules, and AI. Gusev. 2001. Effect of liquid Chromatography Separation of Complex Matrices on Liquid Chromatography-Tandem Mass Spectrometry Signal Suppression. J. Chromatog. A 907:337-342.
14.) Gangl, ET. 2001. Reduction of Signal Suppression Effects in ESI-MS Using a Nanosplitting Device. Anal. Chem. 73:5635-5644.
15.) Niessen, WAM, and AP. Tinke. 1995. Liquid Chromatography- Mass Spectrometry General Principles and Instrumentation. J. Chromatog. A 703:37-57.
You May Also Like


