An Industry Perspective on Quality By DesignAn Industry Perspective on Quality By Design
The US FDA’s quality by design (QbD) initiative and associated ICH Q8, Q9, and Q10 guidance documents are increasingly embraced by the biopharmaceutical manufacturing industry for ensuring consistent product quality and lower costs of development and manufacturing. One critical problem the industry faces involves understanding how to implement QbD and determine the benefit of such projects — which require the work of many groups across quality, manufacturing sciences, and engineering departments. Here we present the results from a survey of biopharmaceutical manufacturing professionals undertaken to determine current QbD understanding in the industry. We outline key gaps and show how QbD has been implemented in practice. We focus on simple, practical implementation of QbD principles and show the perceived value of such investment by industry.
QbD and ICH: A Primer
Extensive definitions of QbD and the associated ICH Q8–Q10 framework can be found in the references (1,2).
PRODUCT FOCUS: ALLBIOLOGICS
PROCESS FOCUS: MANUFACTURING
WHO SHOULD READ: QA/QC, PROCESS DEVELOPMENT, VALIDATION, AND MANUFACTURING
KEYWORDS: RISK MANAGEMENT, DATA MANAGEMENT, STATISTICS, PAT, ICH Q8, ICH Q9, ICH Q10, PROCESS VALIDATION
LEVEL: INTERMEDIATE
The FDA provides a basic definition in a current strategic guidance document: “QbD is understanding the manufacturing process and identifying the key steps for obtaining and assuring a pre-defined product quality” (3). Here we consider QbD with ICH Q8, Q9, and Q10 together as they form part of a broader industry perspective on risk-based manufacturing. The aim is to increase process knowledge through a systematic understanding of how quality attributes are derived.
Understanding how quality relates to the manufacturing process is more difficult in biotech than in many other industries because of the sensitivity of biologic processes to seemingly small changes (both deliberate and unintentional) in process parameters. Although the effect on product quality may be understood, the cause of that effect is not as clear. The combinatorial effect of process variables on product quality traditionally has not been sufficiently evaluated. Historically, that has encouraged a risk-adverse approach to manufacturing process development and improvement due to significant costs associated with process change. Our belief, shared by many others in the industry, is that this has discouraged innovation and kept manufacturing costs comparatively high.

Figure 1:
The QbD approach has been implemented in the biomanufacturing industry in two distinct but related ways. First, QbD increases up-front experimentation as part of process development to establish the operating boundaries between where quality is and isn’t affected. Second, QbD increases the quantity and fidelity of data collection and statistical analysis of manufacturing process parameters to detect changes in a process or in product quality. Figure 1 summarizes the main themes and data flows in each of these two complementary approaches.
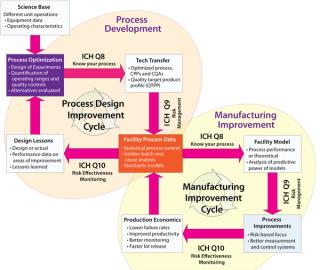
Figure 1: ()
The two cycles of process development and manufacturing improvement are related by way of ICH Q8, Q9, and Q10 through process data. Although each cycle uses data for different purposes (process development to improve current designs and establish better process “platforms”; manufacturing improvement to deliver quality product more reliably), process data are key to both. As such, biomanufacturers are currently attempting to assess how to•
better collect process data (continuous time historians, better laboratory information management systems, batch context)
achieve direct control over processes (through means such as process analytical technologies)
perform more sophisticated analyses of collected data
determine ways to allow more groups in an organization to see and analyze data in real time.
With traditional risk assessment approaches, biomanufacturers are attempting to lower their failure rates to improve quality and productivity and justify implementation of monitoring efforts based on economic value. Increased data accessibility during process development provides information that allows future process designers to properly focus on a robust control strategy and those parts of each process with the greatest risk density. Together, the process and manufacturing improvement cycles provide concrete ways to design and operate better biopharmaceutical production processes, which deliver on the promise of higher quality and lower compliance costs.
Recent FDA (and other) guidance has focused on quantitative aspects of QbD by way of data collection (see the “FDA on Data” box). Explicit mention is made of data collection, statistical analysis, and the need to operationalize analysis methods rather than perform them infrequently and offline.
However, it is far from clear what such guidance actually means in practice for organizations wanting to implement approaches that look more closely at process–quality relationships.
Industry Perspective
We assessed the state of the industry through a recent survey conducted with BioProcess International (survey details available on request). The goals of our survey were to determine the level of implementation of QbD, key advantages companies perceived in the approach, and challenges encountered in justifying implementation of QbD and ICH Q8–Q10 guidelines.
The FDA on Data
“Managers should use ongoing programs to collect and analyze product and process data to evaluate the state of control of the process.”
“We recommend that a statistician or person with adequate training in statistical process control techniques develop the data collection plan.”
“We recommend continued monitoring and sampling of process parameters and quality attributes … Process variability should be periodically assessed.”
From CDER/CBER/CVM. Guidance for Industry: Process Validation — General Principles and Practices. US Food and Drug Administration: Rockville, MD, January 2011; www.fda.gov/downloads/drugsguidancecomplianceregulatoryinformation/guidances/ucm070336.pdf.
Figure 2 illustrates a disconnect between the current, perceived importance of QbD and its implementation state in the industry. Most companies have some assigned budge
t and dedicated staff associated with QbD — with >50% of survey respondents identifying it as “important.” However, despite this level of interest, few companies use QbD today in regular filings. Most current approaches are based on limited piloting of QbD.
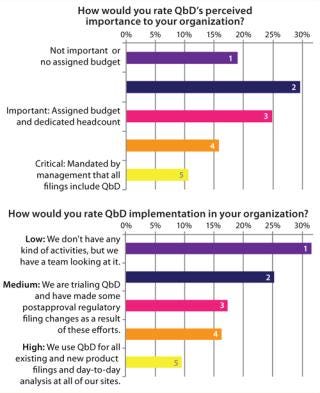
Figure 2: ()
Similar analysis applies to implementation of ICH principles (Figure 3). ICH Q8 calls for increased experimentation to determine the importance of variables and potential interactions that affect product quality. Although Q8 has been implemented at many companies, few have established a comprehensive model for continuous quality verification, which is a central goal of ICH guidelines.
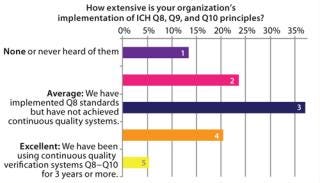
Figure 3: ()
The nascent state of the industry in this regard presents a number of questions: To what extent should QbD be embraced by an organization? What concrete steps should be taken to change manufacturing systems? And should QbD be focused primarily around development or manufacturing — or both?
Perceived Benefits and Roadblocks
The overwhelming majority of survey respondents identified the primary benefit of QbD as a better understanding of manufacturing processes leading to higher product quality. Figure 4 shows top reasons for implementing QbD. They are all tightly aligned with FDA goals for QbD as well as the overall ICH Q8–Q10 goals: a better understanding of process fundamentals. This, in turn, leads to increased flexibility in process design and an ability to make changes after regulatory filing as well as an increased understanding of key business risks.
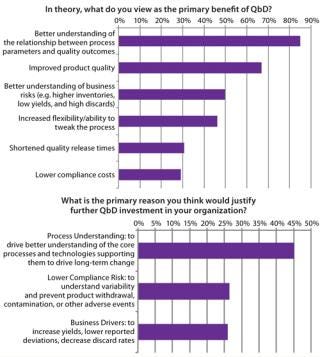
Figure 4: ()
Although the potential benefits of QbD are well known, biomanufacturers experience road blocks in its actual execution. Difficulty with implementing QbD relates to two main themes, both based in a lack of information. First, knowledge is limited regarding business drivers and return on investment (RoI) associated with implementing QbD (Figure 5). Evidence available suggests that once such systems are in place, they do have significant benefits across manufacturing, quality, and process development. Biomanufacturers implementing such systems can expect to see productivity improve as resources are focused on a small number of key variables. Closer monitoring of that reduced set can justify faster batch release and dramatically decrease the time required to perform root-cause investigations. But we need to report on success stories in the industry to help justify the up-front costs associated with QbD.
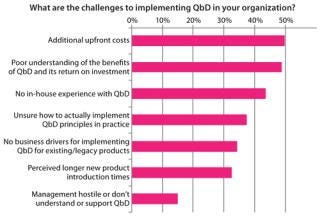
Figure 5: ()
The second issue slowing implementation is a lack of practical knowledge related to putting QbD into practice. Figure 5 also shows that biomanufacturers are unaware of what steps to take in applying QbD to their processes and organizations. For example, statistical process control (SPC) techniques are currently used in other industries (such as semiconductor manufacturing), but those cannot be applied “ad hoc” to biotech because of the inherently high levels of biologic variability, and sequentially dependent results (autocorrelation) (4).
A Roadmap to Continuous Quality Verification
Whether biomanufacturers choose to increase experimentation and incorporate QbD-related concepts in their regulatory filings, the operations community has come to broad consensus regarding the importance of increasing process knowledge. Most biomanufacturers collect large data sets about their processes. However, the challenge is to ensure that what’s collected is in the correct format and to adopt tools that use the information in the best way to gain insights into processes. Reuters reported in December 2010 that Erich Hunziker (head of IT at Roche) called dealing with this ever-growing steam of data one of his biggest concerns (5).
Biopharmaceutical manufacturing organizations have (to a greater or lesser level of sophistication) adopted the following four steps in this regard: Collect the right kind of data; perform biotech-informed SPC and statistical quality control (SQC); correlate process parameters to quality attributes; and create a comprehensive stochastic model.
Below are some successful approaches to those steps that have been applied in the industry.
SPC and SQC seem to be the first significant QbD-related changes to biomanufacturing. SQC is retrospective (e.g., testing quality processes into a manufacturing process), whereas SPC is prospective (e.g., real-time process variable monitoring). These tool sets have the ability to provide insight by focusing on variation of a process from a “mean” or reference batch. Variability is both significant in biotech and typically the cause of quality variations. So it makes sense to establish SPC controls that can more accurately detect and control those variations.
Figure 6 shows survey results relating to adoption and sophistication of SPC/SQC approaches within biopharmaceutical manufacturing. Data indicate that SPC is in use by ∼50% of manufacturing companies, but its use is mostly offline and constrained to performing analyses that support experimental design rather than activities on the
“shop floor.”
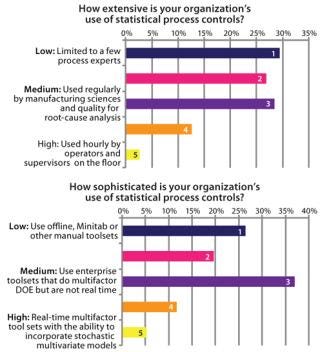
Figure 6: ()
SPC has been very successful in other industries (e.g., automotive and semiconductor manufacturing) for driving costs lower and quality higher. However one issue with its implementation in biotech is that biological processes are both highly sensitive and inherently variable. That can lead to false positives — SPC readings that appear to be trending out of control but are actually not — and those need to be carefully accounted for. Poor application of SPC theory to a process, low understanding of the fundamental drivers of a process, and poor ICH Q8 effort to determine critical process parameters can all cause problems.
Figure 7’s sample X-bar chart from Bio-G’s Crosswalk software shows deviations from a sample mean. Certain trends (e.g., the upward trend to the right) can be detected using statistical methods. Here, the red star identifies one. The colored regions are calculated from sample data and used to calculate whether a process is in or out of statistical control. (This is distinct from a control limit, which is defined according to regulatory filing documents as a deviation from the process important enough to require special investigation.)
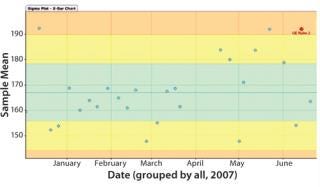
Figure 7: ()
Graphs such as those in Figure 7 and 8 are important for two reasons. First, they provide a means to extract patterns from single data sources and identify points at which corrective action needs to be taken independent of a specification limit. That provides a more sensitive manner of detecting issues than alarms that are at best lagging indicators that lack textured information because they offer only a “binomial view” of the process (within or outside specification). Second, these graphs are easy for operators to understand. So they can be used in real time on the shop floor (rather than offline with applications such as Minitab software). This moves adverse event identification (and root-cause analysis) closer to where problems occur — rather than being performed after the fact by statistical process experts with less operational knowledge of affected manufacturing systems.
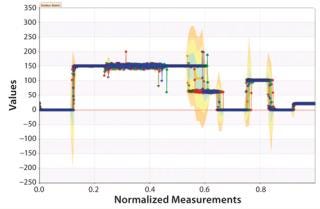
Figure 8: ()
Correlation of Process Parameters to Quality Attributes: Another aspect of QbD that is currently under examination is how to relate process parameters to adverse quality events. This was identified in our survey results as one of the most important potential benefits for QbD (Figure 4), but the biotech community is debating how best to approach it. One option is multivariate SPC; however, the sheer number of possible interactions between process parameters and quality outcomes complicates this approach.
Another strategy that has met with success is performing large-scale correlations of process parameters with one another and with quality attributes (or measurable surrogates for them). Figure 9 shows one such correlation. Each cell in the “heat map” correlates that process parameter with associated quality attributes. Hot-colored cells indicate either high positive or negative correlation and cool colors little or none. The advantage of such a technique is that it is rapid. It provides visual references to those untrained in complex stochastic methods. Users can exclude >90% of the possible set of interactions and focus on those remaining, for which interactions are important. This offers multiple benefits in relation to the ICH guides. It reinforces process knowledge (ICH Q8) and supplements risk-based assessments performed as part of ICH Q9 activities (by evaluating probability of occurrence and detection in near real time). And it can be continual to promote risk-effectiveness monitoring (ICH Q10).
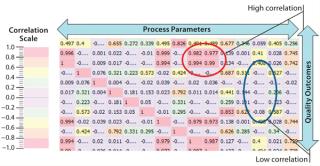
Figure 9: ()
Stochastic Control Tool Sets: The biopharmaceutical industry’s approach to stochastic control tool sets is evolving. In mapping current tool sets, it becomes clear that more advanced use of QbD will rely on our ability to analyze collections of data sets that are highly complex, highly variable, and autocorrelated. Figure 10 shows some tool sets available today.
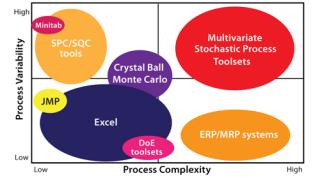
Figure 10: ()
The industry is currently leaning toward multivariate stochastic process tool sets. They go beyond simple correlation and SPC analysis of raw data. These tool sets combine real-time data with a model that can be used to understand the relationship between a process parameter in one unit operation and its effect on quality throughout the manufacturing process. This is a ne
cessary precursor to implementing true real-time release and “release by exception” methods by allowing companies to look at how a batch evolves through many processing steps will map against the design space.
Time to Get Started
Quality by design and associated ICH guidelines are becoming increasingly important in the biotherapeutics industry, which is currently focused around the initial stages: data collection, SPC/SQC pilots, and mostly offline analysis. Clearly there are significant capital drivers for implementing such projects. These benefits come in
improved productivity (focusing resources on what is often a small number of key variables)
fewer variables allowing real-time monitoring and timely release of product (a closer observation of key process parameters and quality outcomes)
improved control strategies and robust risk assessments
a valuable knowledge management system (people no longer spend substantial periods performing root-cause analysis)
lower rates of production failure and scrap.
Figure 11 shows some of the next steps. Biotech companies will need to get the QbD basics right. Forming a team to look more closely at QbD and data collection was cited most frequently in our survey results (by 61% of respondents).
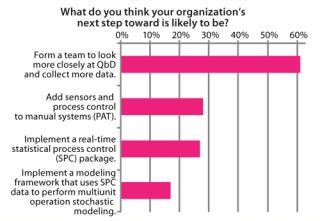
Figure 11: ()
It is clear from our survey that biomanufacturers believe in the importance of QbD and associated ICH guidelines. Although a significant number of roadblocks to implementation remain, biomanufacturers are looking at QbD as a method for increasing process understanding and driving fundamental improvements to quality. Such an approach will also lead to development of processes and technologies that are increasingly flexible and adaptable to the changing needs of the market.
About the Author
Author Details
Corresponding author Dr. Rick Johnston is executive director of the University of California at Berkeley’s CELDi Center for Research in Biopharmaceutical Operations, an adjunct professor at Keck Graduate Institute (Claremont Colleges), and founder and CEO of Bioproduction Group, 1250 Addison Street, Suite 107 Berkeley, CA 94702; 1-510-704-1803, fax 1-510-704-0569; [email protected], www.bio-g.com. James Lambert ([email protected]) is director of quality engineering at Genentech’s Hillsboro, OR fill–finish project. And Emily Stump ([email protected]) is a validation scientist for Commissioning Agents, Inc.
REFERENCES
1.) McCormick, K. 2008. Introduction to ICH: Essential Background to PQLI. Pharmaceut. Eng. May–June:1-3.
2.) Berridge, J. 2009. PQLI: What Is It? Pharmaceut. Eng. May–June:33-39.
3.) US Food and Drug Administration.
4.) O’Neill, J.. Continued Process Verification for Biological Processes.
5.) Hirschler, B.. Roche Fears Drug Industry Drowning in “Spam” Data.
You May Also Like


