Modeling Perfusion Processes in Biopharmaceutical ProductionModeling Perfusion Processes in Biopharmaceutical Production
February 1, 2011
Perfusion processes are considered more difficult to model than batch-based fermentation processes because up to a third of a perfusion-based campaign is spent outside “steady-state” production mode. Variabilities in cell density, titer, and harvest rate (HR) during ramp-up necessitate planning and explicit modeling of variabilities in these processes and their subsequent downstream operations. Longer continuous fermentation times require more rigorous attention to risk than do batch-based systems. A flexible purification platform must respond to changing fermentation conditions.
Here we discuss strategies for modeling perfusion at our company and how simulation models can be used to create flexible, “just-in-time” facilities that respond to manufacturing conditions.

Background
Perfusion processes are well established in food and other life-science industries, in which continuous production can create relatively high product concentrations and volumetric throughput. However, biopharmaceutical manufacturing is mostly batch-based for a number of reasons: lower perceived contamination risks, batch-to-batch segregation, and historical legacy (1,2). Despite those reasons, perfusion is used by a number of biomanufacturers because it produces large product quantities using smaller bioreactors than would be possible with batch-based production (3). Perfusion can be advantageous for less-stable products because continuous collection shortens their bioreactor residence time (4).
PRODUCT FOCUS: ALL BIOLOGICS
PROCESS FOCUS: PRODUCTION
WHO SHOULD READ: PROCESS DEVELOPMENT, MANUFACTURING, FACILITY DESIGN/ENGINEERING, OPERATIONS
KEYWORDS: BIOREACTORS, SIMULATION, VARIABILITY, HARVEST, BUFFER/MEDIA PREPARATION, PROCESS OPTIMIZATION
LEVEL: INTERMEDIATE
Figure 1 outlines some critical process differences between perfusion-based and batch-based biopharmaceutical production methods. Unsurprisingly, current biomanufacturing models are more suited to batch-based than to perfusion-based processes. Batch-based production is sequential and takes a set amount of time at each processing stage without splitting or combining batches during production. The concepts of cell growth and titer evolution are embedded within each batch’s fermentation process, so its state need not be considered in subsequent process steps. Contaminations are limited to a single unit operation and have the same result in almost all cases (loss of a single batch). There is no “recourse” if a batch fails (such as speeding up short-term production rates or splitting material from other batches to inoculate a production scale vessel).
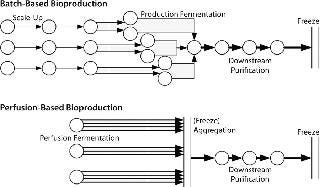
Figure 1: ()
So batch-based bulk manufacturing facilities are comparatively simple to model but limited in their flexibility. Conversely, perfusion-based processes require some consolidation of material between processes. Cell growth and titer evolution must be expressly considered into their processing strategy. A perfusion model is not batch-based, but time-based, more dependent on a bioreactor’s producing material, and exhibits more process variability. Most modeling soft ware is batch-based and was not designed to model continuous processing or high-variability processes. Such tools are limited in their applicability for perfusion-based processes.
Models often have difficulty in accurately capturing and optimizing perfusion processes because of variability and risk. Batch-based processing minimizes titer variability by running production fermentations for a long period, then processing a fixed quantity of material all at the same time. Conversely, perfusion processes exhibit a wider range of titers because harvesting begins early, a “ramp-up” period that must be considered explicitly in modeling. Cell residency is also an issue: Perfusion vessels operate continuously for significantly longer without clean-in-place (CIP) or steam-in-place (SIP) procedures to prevent contamination. Risk of contamination is an increasing function over the number of days a bioreactor runs continuously, so backup reactors and contingencies must also be considered by a process model (5).
Despite the fact that perfusion is more complex to model than batch-based production, it also provides more opportunity to optimize production. Here, we examine first how to accurately model the HR and campaign duration of a perfusion bioreactor. It is not constant over a perfusion campaign and must be accounted for in many aspects of production (including media preparation) as well as the frequency of downstream processing and associated buffer preparation requirements. Second, we look at policies for optimizing media and buffer preparation around such a process to minimize labor and floor space requirements without stocking out.
Harvest Rate Model
In a perfusion-based process, harvest of cell culture fluid begins significantly before cell density or titer has reached a steady state. After inoculation of the bioreactor, cells grow in batch mode until a specific cell density is achieved, at which point perfusion is initiated at a low HR. That rate is adjusted daily based on a calculation to target a defined cell-specific perfusion rate. Once HR reaches a maximum value, it will not be adjusted for the duration of a batch run.
Figure 2 is a sample graph of continuously observed harvesting for two sample bioreactor runs at BioMarin Pharmaceutical. (All data herein have been redacted to preserve confidential information. Samples provided were generated based on randomized data.) Three key periods of production are shown in Figure 2: ramp-up, steady-state, and bioreactor termination. In the ramp-up phase, the slope of the graph depends on the growth rate of cells in a bioreactor. So HR is not fixed, with a variable amount of product coming out according to observed titers and cell density. The second phase (a steady-state production quantity) is reached after 18–35 days, with a fixed number of vessel volumes of product extracted each day from the bioreactor and replaced with fresh media. The duration of that steady-state period also varies, and a bioreactor run may be terminated based on a number of conditions. Figure 2 shows two termination dates: one at day 53, the other at day 85.
get=”_new” style=”text-decoration:none;background-color: #f7f7f7;color:#000000;” >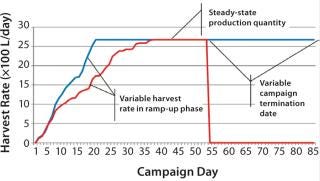

Figure 2: ()
Comparing those two sample bioreactor runs aids in calculating a 22% difference in the overall amount of product collected from the two bioreactors between days 0 and 34.
Examining days 0–85 shows a 97% difference in the amount of product collected between those two batches. Such high variability between two otherwise identical batches suggests that designing an accurate production model must account for variability.
Figure 3 shows the slope of the graph observed from Figure 2, indicating daily increases in HR. There is no clear statistical pattern to the data; knowing the rate for one day does not allow you to predict the next day’s rate. (An exception is described below.) An exponential growth pattern (the common model used for cell growth patterns under no physical constraint) is not observed. Instead, the data seem to be dominated by random variability in cell growth and corresponding HR increases.
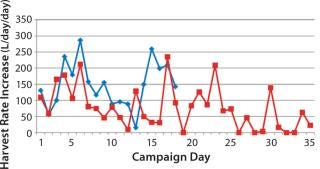
Figure 3: ()
Figure 4 shows an aggregation of the data from Figure 2: across all run days and for a larger sample set of 30 batches conducted in 2008 and 2009. The histogram shows a bimodal distribution, with a large number of observations (nearly 20%) of no significant HR increase from day to day. When it did increase, however, the median increase was 120 L/day/day, with observed rates of up to 510 L/day/day.
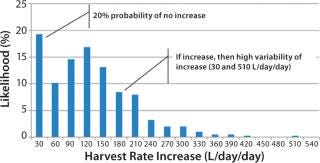
Figure 4: ()
To accurately model cell growth and resulting HRs observed in Figures (234) above, we used a Markov chain representation of the process to design a statistical model of the process evolution. Markov chains are widely used in statistical modeling to represent the evolution of complex, state-dependent processes that depend on some set of parameters but not their entire history (6). Our model uses two parameters to measure HR for the next day: current HR and a condition we call flat-lining, indicating whether or not the HR increased from the previous day.
Figure 5 shows the evolution of the Markov model for the bioreactor ramp-up phase. At day i of a bioreactor campaign, we determine whether HR is increasing. If so, then on day i + 1 the HR will continue to increase with 82% probability or flat-line (not increase) with 18% probability. If it continues to increase, the distribution shown in Figure 3 (without the probability mass at 0) is used to determine the level of increase. If the HR flatlines at any point, then the likelihood that it will continue to do so increases (to 32%), indicating some issue with underlying cell growth. The process continues until HR reaches steady-state conditions.
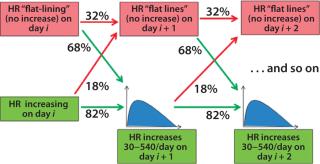
Figure 5: ()
To discover the termination criteria for a bioreactor, we collected data showing the distribution of termination days for one across a number of batches. Most perfusion processes run for a maximum number of days (e.g., 100 days) before ending, but they can also end early due to a number of conditions. We used a geometric distribution to model the ending state according to this formula, where D is the maximum number of days the bioreactor will run, and p is the probability of completing a bioreactor campaign on a given day (which can be determined from historical data):

That distribution assumes that a bioreactor is equally likely to be terminated on any day. Similar Markov-style approaches can be used to allow for nonstationary probabilities. (Because the overall probability is low that a bioreactor campaign will end early, there is typically not enough data to support a Markov-based approach.) Figure 6 shows the cumulative probability that a perfusion bioreactor will end early for sample data, indicating that the total likelihood that it will be brought down earlier than day 80 is 34%.
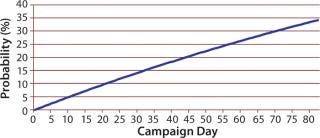
Figure 6: ()
Figure 7 depicts data from our statistical model as a set of generated perfusion bioreactor campaigns. As can be seen, this simulated HR calculation includes all features outlined as critical to model: variation in ramp-up rate, duration, and steady-state operation duration; and early bioreactor termination conditions. We tested the theoreti
cal distribution using several fit tests (Chi-Square and Kolmogorov-Smirnov) using data points from 30 batches to confirm that the distributions obtained were indistinguishable from actual data to a 99% significance level (7).
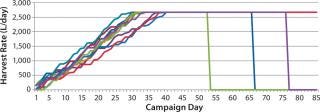
Figure 7: ()
Just-In-Time Media and Buffer Preparation
One significant impact of the variable production rate presented in Figures (234567) is the need to produce media and buffer that support a process with variable production requirements. Whereas a traditional batch-based production environment schedules a fixed number and quantity of media and buffer solutions, perfusion-based processes allow much greater flexibility.
The aggregated harvest pump rate across all operating bioreactors can be seen as the “heartbeat” of a perfusion-based biomanufacturing facility. It directly determines the amount of media that must be prepared to support harvest fluid production as well as the velocity of downstream purification processes required to support production. BioMarin’s limited infrastructure for media and buffer preparation (and limited storage space for media and buffer solutions) necessitated an approach that would closely link consumption with preparation.
BioMarin built a simulation of its perfusion bioreactors, purification, and supporting operations using the simulation system from Bioproduction Group (www.bio-g.com). The goal was to build a highly accurate model of the manufacturing process that could be used to understand questions about capacity. Bio-G’s approach was to implement a simple (s,S) inventory model that would replenish media and buffer bags when they dropped below certain levels (8). Those levels were determined based on consumption rates, expiration times, and overall process variability.
Figure 8 shows sample data regarding HRs from the beginning of the bioreactor campaign (0 days) to a steady state rate for all fermentors reached around day 70 (data shown as a sample only). The HR continually increases on each day, with variability in each fermentor’s growth patterns determining the overall quantity of material collected. The media level shows a classic saw-tooth pattern, which is common with inventory order policies. In this case, media replenishment was triggered when the quantity dropped below 4,000 L on hand.
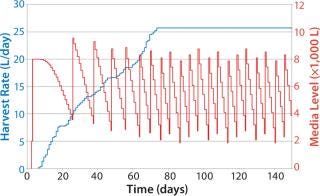
Figure 8: ()
Because it takes some time to prepare media, and due to delays caused by labor and resource availability, the amount of time needed to replenish the media was variable, leading in some cases to <2,000 L of media on hand by the time the batch was replenished. Note that fewer media batches made at the beginning of the campaign than at the end, and the number naturally increases with HR. This approach also allows exact calculation of the risk that media will run out as well as optimization of media use to lower the risk of stockout and expiry.
Figure 9 shows a similar graph, plotting the effect of a simulated early end to the campaigns in some bioreactors. They are taken off line around day 108, with a delay of ~30 days for the cell growth phase (simulated data only). Note the instant drop in media consumption and delayed media preparation (seven media batches prepared after day 100, nine in the previous example). The previous example shows simple use of such inventory policies to regulate media production based on observed bioreactor performance. Such pull-based inventory policies are simple to use and provide an easy method to minimize disruptions caused by inherently variable perfusion-based processes.
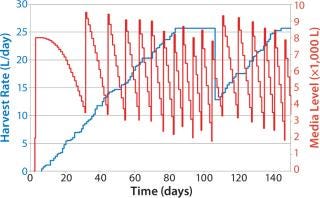
Figure 9: ()
Notably, the same policies can be implemented for supporting operations that are not directly tied to the perfusion process. Figure 10 shows a simple reorder policy implemented for a buffer in downstream purification. The policy calls for an additional 4,000 L to be made when the available quantity drops to 2,000 L. Even in this simple case, the quantity of buffer prepared is automatically tied to the HR despite the complex interrelationships between HR and rate of buffer use. Such an approach can be used to generate high service levels without highly complex planning and execution systems or much replanning.
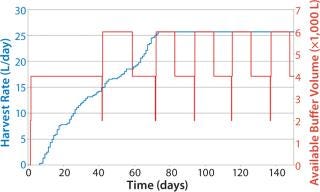
Figure 10: ()
Modeling Challenges: Optimize for Flexibility
Perfusion-based production presents challenges that confound traditional models: higher production variability and the need to explicitly account for risk within simulation models. Perfusion does create an environment, however, in which many more factors can be influenced to directly optimize production. Accurate modeling of cell growth and associated HRs can provide highly accurate simulations that allow manufacturers to explicitly understand the impact of risk and maximize flexibility. The resulting models can be used to optimize facility performance as well as implement just-in-time processes that are superior to push-based schedules for this type of biomanufacturing process.
About the Author
Author Details
Jerome Acuna is manufacturing technical lead, corresponding author Marisa Hewitt is process
engineer, Damian Kirkland is senior planner, and Thomas Shikibu is manufacturing area lead at BioMarin Pharmaceutical Inc., 105 Digital Drive, Novato, CA 94949; 1-415-506-6700, fax 1-415-382-7889; [email protected], www.bmrn.com. Rick Johnston, PhD, and David Zhang ([email protected]) are principals at Bioproduction Group Inc.
REFERENCES
1.) Heath, Kiss 2007. Cell Culture Development: Advances in Process Engineering. Biotechnol. Prog. 23:46-51.
2.) Yang,. 2000. Achievement of High Cell Density and High Antibody Productivity by a Controlled-Fed Perfusion Bioreactor Process. Biotechnol Bioeng. 69:74-82.
3.) Lusher, Scharrer 2009. Evolution of Recombinant Factor VIII Safety: KOGENATE® and Kogenate® FS/Bayer. Int. J. Hematol. 90:446-454.
4.) Ozturk, Hu 2006.Cell Culture Technology for Pharmaceutical and Cell-Based Therapies, CRC Press, Boca Raton.
5.) Lim,. 2005. Application of a Decision-Support Tool to Assess Pooling Strategies in Perfusion Culture Processes Under Uncertainty. Biotechnol. Progr. 21:1231-1242.
6.) Durrett, 1999.Essentials of Stochastic Processes, Springer, New York.
7.) Law, Kelton 1991.Simulation Modeling and AnalysisSecond Edition, McGraw-Hill, New York.
8.) Simchi-Levi,. 2008.Designing and Managing the Supply ChainThird Edition, McGraw-Hill, New York.
You May Also Like


