Rapid Process Development for Purification of a MAbRapid Process Development for Purification of a MAb
Time and flexibility are essential in purification process development for biopharmaceuticals. Easy translation of experimental ideas into process steps and insight into the effects of changes in chromatography parameters both help speed development and contribute toward achieving quality by design (QbD) objectives. An ability to scientifically design product and process characteristics that meet specific objectives is crucial. Opportunities to eliminate manually intensive steps all support an enhanced development process.
A typical monoclonal antibody (MAb) purification process includes three chromatographic purification steps. However, we propose a more time-efficient two-step approach (Figure 1) using the ÄKTA avant 25 system for fully automated process development. With design of experiments (DoE) software incorporated, the ÄKTA avant 25 system can easily and quickly establish optimal chromatography conditions, further reducing process development time (Figure 2).
PRODUCT FOCUS: MONOCLONAL ANTIBODIES
PROCESS FOCUS: DOWNSTREAM PROCESSING
WHO SHOULD READ: PLANT MANAGERS, PROCESS ENGINEERS, ANALYSTS
KEY WORDS: PROCESS DEVELOPMENT, MULTIMODAL CHROMATOGRAPHY, DESIGN OF EXPERIMENTS (DoE), PLATFORM TECHNOLOGY
LEVEL: INTERMEDIATE
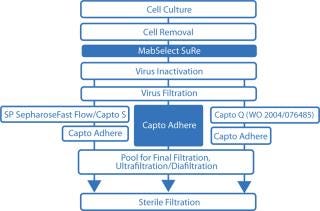
Figure 1: ()
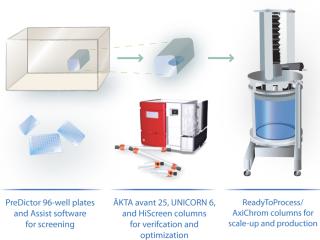
Figure 2: ()
Protein A is the ligand of choice for capture when purifying MAbs because of its high selectivity that provides excellent purity and its ease of use at large and small scale. Protein A–based chromatography media are therefore the basis for a platform approach to MAb purification. You can use various chromatography techniques and combinations of techniques (especially ion-exchange and hydrophobic interaction chromatography) to perform subsequent downstream processing.
A multimodal chromatography medium — capable of anion exchange as well as other types of interactions — enables selective removal of antibody dimers and aggregates (D–A), host-cell proteins (HCPs), DNA, and viruses at the same time (1,2). The high purity obtained after initial capture on a protein-A–based medium (e.g., MabSelect SuRe, typically >99%) combined with a multimodal ion-exchange medium (e.g., Capto adhere) for the polishing step can reduce a traditional three-step process to a highly productive two-step process.
To take full advantage of the benefits of multimodal chromatography medium, you should thoroughly optimize your purification process. For example, conduct polishing using Capto adhere medium in flow-through mode under conditions that allow monomeric antibodies to pass directly through a column while contaminants are adsorbed. Loading conditions are always a compromise between those favoring yield and those favoring contaminant clearance, especially for cases in which several contaminant species need to be removed. Loading conditions therefore need to be optimized, with a trade-off made between yield and purity.
Using the newly developed ÄKTA avant 25 chromatography system, we demonstrated rapid method development for a two-step MAb purification process. Feed was based on a clarified Chinese hamster ovary (CHO) cell supernatant, which was challenging because of the MAb’s low solubility.
Method development included determining elution pH (Figure 3) and dynamic binding capacity on MabSelect SuRe to address step 1 (Table 1) and screening of loading conditions on Capto adhere (Figure 5) followed by a robustness study for step 2 (Table 1). We performed screening and robustness studies using a design of experiments (DoE) application included in UNICORN 6 control software. In DoE, multiple factors are varied simultaneously, and a statistical model is generated for process validation and to support decision making (Table 2).
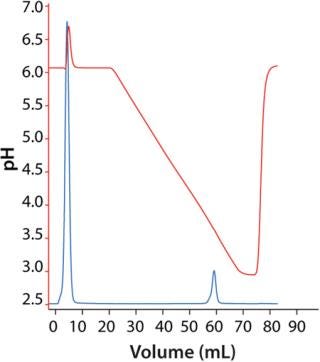
Figure 3: ()
Table 1: Summary of the different columns and conditions used in this study
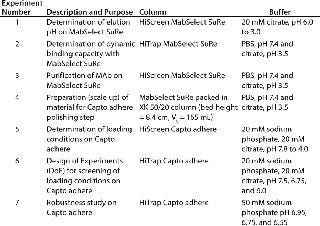
Table 1: Summary of the different columns and conditions used in this study ()
Table 2: Design layout of the DoE for screening of loading conditions and results from the screening
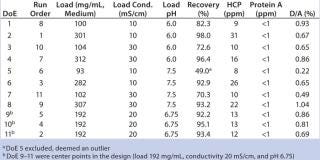
Table 2: Design layout of the DoE for screening of loading conditions and results from the screening ()
Materials and Methods
Columns, Equipment, and MAb Purification: We used the ÄKTA avant 25 system with UNICORN 6 software and two sample inlet valves for automated sample loading and wash. Runs made use of the system’s pressure–flow regulation feature, which prevents excessive pressure from building up during sample loading. We followed the same method for all affinity chromatography runs and used MabSelect SuRe. Capto adhere was used for all ion-exchange runs. We selected prepacked MabSelect SuRe and Capto adhere columns in HiTrap (1 mL) and HiScreen (4.7 mL) formats for various experiment steps (Table 1). An XK 50/20 column was packed with MabSelect SuRe for an optimized polishing step (step 4, Table 1). We conducted the seven experiments summarized in Table 1 to develop the two-step method f
or purifying a MAb using the ÄKTA avant 25 system controlled by UNICORN 6 software.
DoE for Screening Loading Conditions on Capto adhere: Conductivity, pH, and sample load are important parameters for sample loading on Capto adhere (1). Therefore, experiments should be set up to test a number of different conditions simultaneously. We suggest using DoE, which implements statistical analyses to identify and define conditions having the greatest impact on a process or product. Using DoE, we devised a carefully selected set of experiments in which the most important factors were varied and evaluated simultaneously to maximize volume and value of data generated. For method optimization, DoE greatly increases the probability that optimal purification conditions are established.
We used full-factorial DoE (included in UNICORN 6 software) to screen sample loading conditions on Capto adhere (see step 6, Table 1). The full-factorial design consisted of three parameters (sample load, pH, and conductivity), therefore making 23 = 8 experiments and three center points, for a total of 11 experiments (Table 2). Center points corresponded to a sample load of 192 mg/mL chroma-tography medium, 20 mS/cm conductivity, and pH 6.75. Concentration of starting material varied between 10.8 and 11.7 mg MAb/mL, HCP average was 45 ppm, protein A was 2 ppm, and D/A was 1.9%.
MAb elution behavior is defined by its pH at peak maximum (~5.8) and is normally used to define the lower pH in such a design. However, in this case, precipitation occurred in the sample at low pH and low conductivity (<10 mS/cm). Therefore, we set the lower pH in the design to pH 6.0 while maintaining conductivity at ≥10 mS/cm. Upper pH would normally be chosen ~2 pH units above the elution pH, so we set pH to 7.5. Conductivity varied from 10 to 30 mS/cm and load varied between 100 and 300 mg MAb/mL chromatography medium.
Robustness Study on Capto adhere: We performed a robustness study by varying pH, conductivity, and load around conditions established from the screening DoE. Two different feeds and two different chromatography media lots were included. Both feeds had higher levels of contaminants than the feed used in the screening DoE. We set up a reduced design with these five parameters, including eight experiments with different combinations of the parameters and three center points — for a total of 11 experiments (Table 3). Starting material concentration for the two feeds varied from 12.7 to 14.7 mg MAb/mL. HCP concentration was 80 ppm for both feeds.Table 3: Design layout of the DoE for robustness of loading conditions and results from the robustness study

Table 3: Design layout of the DoE for robustness of loading conditions and results from the robustness study ()
Protein A concentration was 3 ppm for feed 1 and 4 ppm for feed 2. D/A averaged 5.3% for feed 1 and 3% for feed 2. DoE 9–11 were the center points in the design (load 200 mg/mL medium, conductivity 15 mS/cm, pH 6.75).
Measurement of Yield, HCP Clearance, Aggregate Content, and Protein A: We determined concentration either by measuring UV at 280 nm, using an extinction coefficient of 1.49, or by using affinity chromatography with a HiTrap MabSelect SuRe 1 mL column on the ÄKTAexplorer 10 chromatography system. To evaluate dimer/aggregate content, we analyzed flowthrough fractions using gel filtration (size-exclusion chromatography) and two interconnected Superdex 200 5/150 GL columns connected to the ÄKTAexplorer 10 system (data not shown). We applied an aliquot of each sample to the column and performed a run in phosphate-buffered saline at a 0.35 mL/min flow rate for 15 min. Measurements at UV at 280 nm and calculation peak area ratios determined aggregate concentration.
We measured HCP levels using commercial anti-CHO HCP antibodies (Cygnus Technologies Inc.). Essentially, we adapted an ELISA methodology to Gyrolab Workstation LIF (Gyros AB, Uppsala, Sweden) using Gyrolab Bioaffy 20 HC microlaboratory disks. We measured ligand leakage (MabSelect SuRe protein A ligand) with a commercial ELISA kit (Repligen Corp.) using a modified protocol.
To conduct SDS-PAGE analysis, we adjusted samples to pH 8.5 with 1 M NaOH. Our working solution consisted of CyDye DIGE Fluor minimal dye (Cy5) in dimethylformamide (5 nmol CyDye to 12.5 µL dimethylformamide). We added Cy5 solution (1 µL) to 50 µg protein and incubated the resultant solution for 30 min in the dark in an ice bath. We stopped the reaction with 1 µL of 10 mM lysine and ran unreduced samples (5 µg/well) on a Multiphor II flatbed electrophoresis system using precast ExcelGel SDS gradient 8–18 gels. An Ettan DIGE imager scanned the gels at several various photomultiplier tube voltages (because of the significant difference in the amount of MAb and amount of contaminant). Results and Discussion
Our two-step purification process comprised a protein A-based capture step and a multimodal anion-exchange polishing step. Using ÄKTA avant 25 system controlled by UNICORN 6, we achieved process development in approximately one week. The method enabled recovery of a high-purity MAb. The purity achieved (Table 3) would be considered suitable for most therapeutic uses.
The material we used was challenging, primarily because of precipitation of the sample that necessitated running the second step at elevated conductivity. A lower conductivity would normally result in better contaminant removal (1). Another challenging aspect was the increased aggregation of MAb over time and at low pH or conductivity. Sample used for the first experiments was lower in D/A than that used in later experiments. Thus, sample used in the robustness study contained a higher percentage of D/A.
Capture of MAb Using MabSelect SuRe: We eluted the MAb in a linear pH gradient (Figure 3). Elution pH was 3.7 at peak maximum and 3.6 at 10% of peak maximum (descending). Therefore, we decided to use an elution pH of 3.5, which would result in high yields and narrow peaks. Dynamic binding capacity at 10% breakthrough (DBC 10%) was 21 and 40 mg/mL at residence times of 2.4 and 4 min, respectively.
Purification of MAb on MAbSelect SuRe: Figure 4 shows a chromatogram following purification of the MAb on a HiScreen MabSelect SuRe column. We achieved a recovery of 99% with HCP at 25 ppm, 0.8% D/A, and a protein A leakage of 6 ppm.
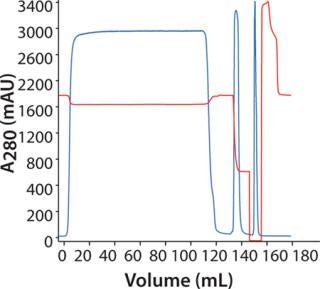
Figure 4: ()
Scale-Up on XK 50/20 Column Before Capto adhere Polishing Step: Using the ÄKTAexplorer 100 system, we scaled up our method to an XK 50/20 column to prepare material for polishing experiments (data not shown). We used purified antibody pools from the XK 50/20 runs for screening and robustness runs on Capto adhere. Levels o
f HCP, protein A, and D/A were somewhat higher in the XK 50/20 scale-up than during previous runs.
Polishing Step: For initial screening, we loaded 3 mg of MAb on HiScreen Capto adhere column at pH 7.8. Elution occurred with a linear pH gradient from pH 7.8 to 4.0. The MAb eluted in a relatively broad peak (Figure 5), and pH at peak maximum was 5.8. Elution position defines lower pH in the design for further optimization. However, because of precipitation at low pH and conductivity, we set lower pH in the design to 6.0 and maintained conductivity at ≥10 mS/cm.
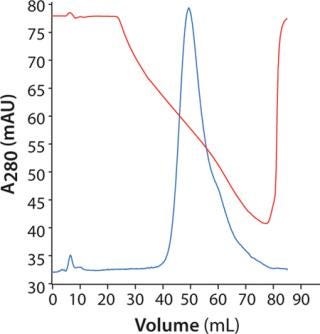
Figure 5: ()
DoE for Screening Loading Conditions: Figure 6 shows a typical flow-through chromatogram (whereby MAb elutes in flow-through) from the screening design using HiTrap Capto adhere. Table 2 lists a summary of data from the design. The chromatogram is representative of a DoE center point for screening (Table 2).
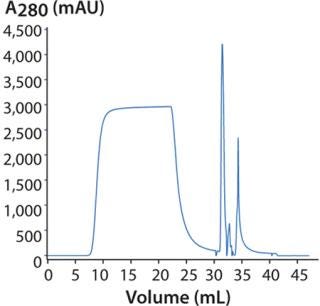
Figure 6: ()
Figure 7 shows results from the screening DoE. They were visualized in three ways: summary of fit, coefficient plot, and contour plot functionalities. We anlayzed three responses: recovery, HCP removal, and aggregate (D/A) removal. A fourth response, protein A leakage, was too low to support design of a statistical model. In fact, the leakage we observed in eluted fractions from the HiScreen MabSelect SuRe column was already very low.
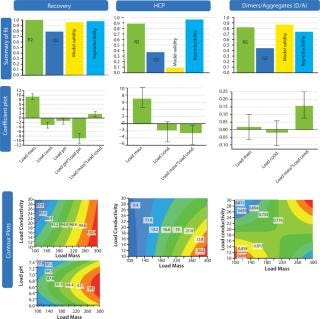
Figure 7: ()
In the summary-of-fit plots, percent variation of the response explained by the model (R2) >0.8 for both the recovery and aggregate models indicated a good model fit. We obtained a high predictive power (percent variation in response predicted by the model according to cross-validation, Q2) in the model (>0.5) for both factors. Model validity values indicated good models with values >0.5 and excellent models with values >0.9. For HCP removal, we obtained a model of moderate quality and low validity. Reproducibility — the measure of replicate variation obtained for this model — was >0.5, thereby indicating minimal error and good control of experimental procedures. Coefficient plots display regression coefficients with confidence intervals. Significant coefficients remained in the model, as well as some insignificant coefficients if an interaction term was significant. Contour plots show the effect of two factors on specific responses. As expected, increased load positively influenced recovery while contaminant clearance was improved at lower load.
Robustness Study on Capto adhere: Table 3 lists results, and Figure 8 shows SDS-PAGE analysis of the individual DoE runs and the two different feeds used. Figure 9 shows a summary-of-fit plot from the robustness study. No model could be built from results we obtained, thus we deemed the conditions to be robust. This view is supported by the SDS-PAGE results in which no obvious differences between the 11 DoE lanes/runs are seen (Figure 8).
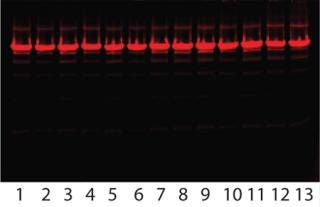
Figure 8: ()
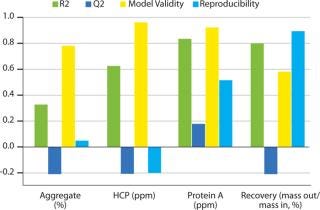
Figure 9: ()
Rapid Process Development
A two-step chromatography process was developed in approximately one week using the ÄKTA avant 25 chromatography system with UNICORN 6 software in combination with prepacked HiTrap and HiScreen columns, packed with either MabSelect SuRe or Capto adhere. With these selectivity and generic method conditions, we achieved straightforward method optimization. The flexible design of ÄKTA avant 25 system facilitates modification of the standard flow configuration. In our study, we used two sample inlet valves to enable automated sample loading and wash without additional loss of sample.
Our DoE approach was extremely useful for screening and optimizing conditions for the Capto adhere polishing step. The DoE module in UNICORN 6 software facilitated the scientific identification of process parameters, enabling a quick setup of run schemes for determining optimal and robust conditions, and thus supporting enhanced productivity and delivery of QbD processes.
About the Author
Author Details
Anders Ljunglöf is a scientist; Kjell Eriksson is a senior scientist; and Tuomo Frigård is a scientist at GE Healthcare; [email protected]; www.gelifesciences.com.
REFERENCES
1.) 2007.Application Note: Optimization of Loading Conditions on Capto adhere Using Design of Experiments. 28-9078-89. Edition AA, GE Healthcare, Uppsala.
2.) Eriksson, K. 2009. MAb Contaminant Removal with a Multimodal Anion Exchanger.: A Platform Step to Follow Protein A. BioProcess Int. 7:52-56.
You May Also Like


