Shear Assessment for Cell-Culture Clarification in a Disc-Stack CentrifugeShear Assessment for Cell-Culture Clarification in a Disc-Stack Centrifuge
Clarification of bulk cell-culture broth is the first step in biologics purification. Solid particles such as cells and cellular debris are removed, and the resulting material is processed through 0.2-µm filters in preparation for primary affinity-chromatography steps. Typically, clarification involves either two-stage depth filtration or centrifugation followed by one-stage depth filtration. Beckett reports that although two-stage, cellulose-based depth filters are an established clarification technology, associated cost and space constraints limit depth-filtration–only processes to culture volumes of 4,000 L (1). For larger capacities, biomanufacturers prefer to use a disc-stack centrifuge (DSC) for the first clarification step (1).
DSC processes can be scaled up by maintaining a constant ratio of centrifuge feed-flow rate (Q) to gravity equivalent setting area (Σ). The latter variable represents the area required for particle settling under gravity for specific operation conditions and equipment designs (2). Thus, the Q/Σ ratio serves as a surrogate measure of a centrifuge’s particle-settling capacity. Application of the ratio assumes that the solid particles subjected to centrifugal force are shear resistant and that they remain intact during centrifugation. However, mammalian cells are sensitive to shear, and damaging them can release intracellular components — e.g., host-cell DNA (hcDNA), proteins (HCPs), and proteases — that increase impurity loads in clarified harvest material and that reduce therapeutic-protein levels in resulting products (3, 4).
As companies transition biologics production from small-scale processes in single-use equipment to large-scale manufacturing, process engineers must consider the effects of shear from DSCs. Operating conditions for such equipment should be selected based on a design space that balances particle-settling capacity (Q/Σ) and shear. Although available literature includes extensive discussions about the Q/Σ ratio, it provides no straightforward scale-up methodology for assessing shear generated during disc-stack centrifugation. Herein, we discuss three methods for shear assessment in a DSC as a function of centrifuge design and operational parameters: the eddy-length, tip-speed, and power-dissipation models. Furthermore, we illustrate the operational design space for a DSC, showing a balance between particle-settling capacity and shear.
Method 1: Particle-Eddy Length
Fluid-Flow Velocity (ϑL): The particle-eddy length model assumes that fluid flow between the disc spacing is laminar, that flow is divided evenly among all available disc spaces, and that settled particles do not return to the annular spaces between discs (5). Given those assumptions, Equation 1 calculates the velocity of fluid flowing through the annular spaces between discs (Figure 1a) (5). Here, Q represents the centrifuge feed flow rate in m3/s, nds denotes the number of disc spaces, and Aavg is the average cross-sectional area for fluid flow between the disc spacing. Ro and Ri are the outer and inner radii of a centrifuge’s conical discs, and h is the distance or spacing between discs.
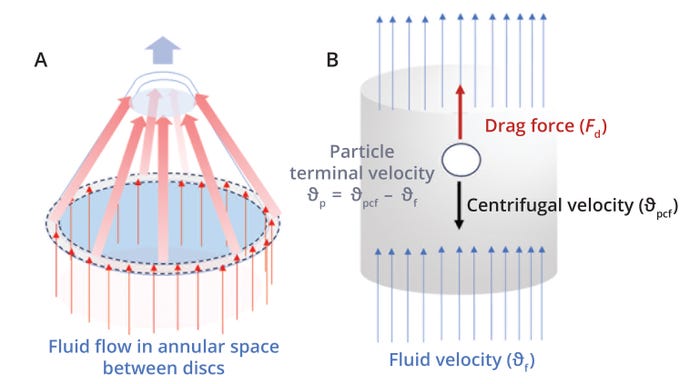
Figure 1: Fluid and particle flow between discs in a disc-stack centrifuge.
Particle Velocity Under Centrifugal Force (ϑpcf) in Static Fluid Conditions: As a centrifuge bowl rotates, centrifugal force accelerates particles outward from the center axis. Equation 2 gives the centrifugal velocity of a particle in a static liquid (5). Therein, ρL and µL represent the fluid’s dynamic density and dynamic viscosity, respectively; ρL = 1015 kg/m3 and µL = 1.05 × 10⁻³ P.s are good approximations for a typical cell-culture broth at harvest (4, 6). The variable dp denotes the particle diameter.
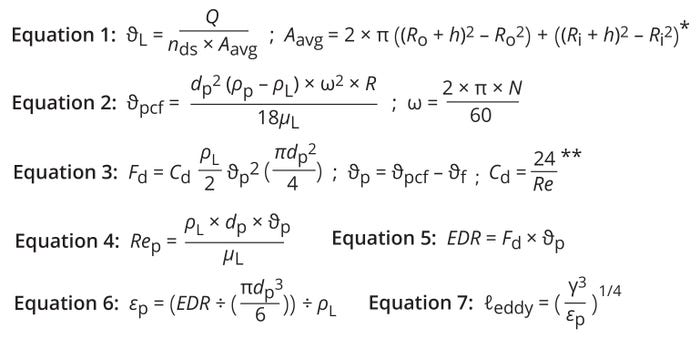
Equations 1–7: Shear assessment based on the eddy-length method. * Aavg is the average cross-sectional area between the outer and inner radii of concentric discs. ** This expression is for spherical particles in a Stokes-flow regime.
Maschke et al. report that Chinese hamster ovary (CHO) cell size follows a Gaussian normal distribution ranging 10–20 μm and with an expected average size of ~14.45 μm (16). Thus, dp often is assumed to be 14.5 μm for applications of cell-culture harvest (4). However, a more stringent value of 20 µm is recommended in DSC applications for cell recirculation to bioreactors operating in perfusion mode because most types of (viable) mammalian cells can range in size up to 20 µm in diameter. N is the centrifuge bowl speed in rotations per minute (RPM), ω is the angular velocity (in 1/s), and R is the radius of rotation. For shear assessment, R is assumed to be Ro as a conservative approach.
Drag Force (Fd): Drag force refers to the force of friction on a particle that resists its motion through a fluid. Under centrifugation, bulk fluid flows opposite to particles’ settling direction, and during settling, particles experience a drag force due to relative motion between the fluid and particles. Drag acts in the direction opposite to a particle’s motion (the same direction as fluid flow). Therefore, the relative particle velocity, also called the slip velocity (θp), equals the difference between the particle centrifugal settling velocity for a static liquid (θpcf) and the fluid velocity between the disc space (θf) (Figure 1b). Balance between the drag force and centrifugal force acting on the particles enables those particles to achieve a constant θp velocity (7).
Based on Stokes’s law, Equation 3 gives the drag force that acts on a moving particle placed in a fluid flowing in the opposite direction (8). The formula depends on four assumptions: As particles pass through a centrifuge, they remain spherical in shape and do not aggregate or break. Particle concentration in the suspension is low enough to prevent settling hindrances. Centrifuged particles move in a radial direction and do not move tangentially at any time during the process. And particle-settling velocity falls in the laminar-flow (Stokes) region; thus, the Reynolds number (Re) should be <0.4 throughout the process.
Drag Coefficient (Cd): For spherical particles in a Stokes-flow regime, Cd is calculated as a function of the Re value, as shown in Equation 3 (9–11).
The Reynolds number is a dimensionless quantity calculated as the ratio of inertial to viscous forces within a fluid flow, assuming that inertial force causes the flow and that viscous force resists it. Therefore, flows with low Re values are characterized as laminar and smooth, whereas flows with high values are deemed to be turbulent. Clark and Blanch consider Re < 0.4 to be a laminar-flow (Stokes) regime, Re = 0.4–500 to be a transition-flow (Allen) regime, and Re > 500 to be a turbulent-flow (Newton) regime (9). The writers also report that cell and protein settling under centrifugation typically occurs under a laminar (Stokes) regime (9). As shown in Equation 4, Mei presents an expression for determining the Re value for a moving particle in flowing liquid (12, 13).
Energy Dissipation Rate (EDR): During settling in a centrifugation process, the EDR represents how quickly a flowing fluid loses kinetic energy as particles move through and experience drag. The rate depends on both particle speed and drag-force magnitude (Equation 5) (8). The specific EDR (єp) per cell equals the EDR divided by the cell volume (Equation 6) (8).
Kolmogorov Eddy Length (ℓeddy): During centrifugation, a fluid’s kinetic energy dissipates from large eddies and cascades into smaller ones. Eddies that are shorter than a cell’s diameter can kill the cell. Equation 7 shows how to calculate the Kolmogorov eddy length, which for our purposes represents the shortest eddy in a centrifugation process. An ℓeddy value can be used as a scalable parameter to maintain the same amount of cell shear across DSCs (9). In Equation 7, γ refers to a fluid’s kinematic viscosity (m2/s).
Cell Damage Index (CDI) and Model Fitting: Lactate dehydrogenase (LDH) is an enzyme present in mammalian cells. Because it is released during cell rupture, analysts often use it during shear assessments as an indicator of cell damage. For instance, Shekhawata et al. present shear-stress values for a cell-culture clarification process using a Culturefuge 100 (BTPX305H) DSC system from Alfa Laval (13). The team applied computational fluid dynamics (CFD) to predict shear levels, then verified the resulting projections against measured LDH values for different combinations of centrifuge bowl speed and feed flow rate.
Using the writers’ LDH values as response variables and using ℓeddy values calculated from Equation 7 as explanatory variables, we applied the Fit Model function and Standard Least Squares personality in JMP software (version 16.0) to evaluate the eddy-length model’s prediction of shear levels in a DSC system (Figure 2). Figure 2 shows a linear relationship between LDH concentrations and calculated ℓeddy values. The data exhibited p-values of 0.0008 and <0.0001 for the eddy length and intercept, respectively. Both values are <0.05, indicating that the strength of association between the input variable (ℓeddy) and output prediction (LDH concentration) has a high degree of statistical significance. Thus, application of a constant ℓeddy value could be an effective method of shear assessment during DSC-process scale-up.
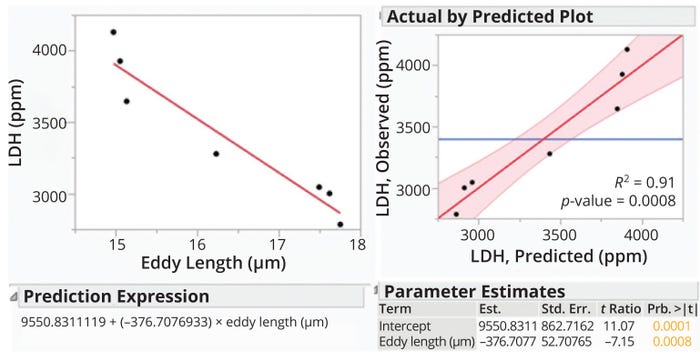
Figure 2: Demonstration of shear prediction for a disc-stack centrifuge using the Kolmogorov eddy-length method; Est. = estimated value, LDH = lactate dehydrogenase concentration, Prb. = probability, Std. Err. = standard error.
Particle-Settling Capacity of the Centrifuge: To maintain the same settling capacity across different makes and models of centrifuges, we applied a constant Q/Σ ratio. Equation 8 shows how to calculate that ratio for a DSC (4, 9). Therein, g denotes gravitational acceleration (9.8 m/s2), and Θ represents the half-cone angle of centrifuge discs (in radians). Centrifuge manufacturers typically report that angle in degrees (°), but the half-cone angle can be converted from degrees to radians by multiplying the angle by a factor of π/180°.

Equations 8–10: Particle-settling capacity.
Stokes’s law for the settling of solid particles enables calculation of the smallest particle size that can be removed under centrifugation (Equation 9) (4, 9). Ambler reports that such calculations are based on sigma theory and thus give nominal rather than absolute values (14). Pham adds that only 50% separation efficiency is achieved for the calculated particle size (dp,min) for a given Q/Σ ratio (4).
Setting a Design Space for DSC Operation — Cutoff Criteria for Settling Capacity: Pham reports an average particle size of 0.5 µm for a cell-culture harvest clarified using a DSC (4). Parau et al. report that MilliporeSigma’s Millistak D0HC filters — which can be used as the first stage in a two-step, cellulose-based depth-filtration process — have a nominal rating of 0.6–9 µm (15). Biomanufacturers often apply such filters and DSCs interchangeably depending on operational scale (1). Thus, setting a cutoff value (dp,min) of <0.6 µm is a good approach for controlling particle size and settling capacity in a DSC-operation design space.
Setting a Design Space for DSC Operation — Eddy Length: For CHO cells in the stationary phase of growth, Maschke et al. observe an average cell size of 13.57 µm ± 1.02 µm (16). Nienow reports that maintaining eddy sizes of >18 μm should prevent fluid-dynamic damage during most CHO-cell cultures (17). Because most mammalian cells are <20 μm in diameter (8), setting ℓeddy to <20 μm should ensure that a centrifuge operates in a shear-proof zone. However, in a study on CDIs, Shekhawat et al. recommend an LDH concentration of ~1,200 ppm for a shear-proof design (13). That value is equivalent to an ℓeddy length of 22 µm. Therefore, a conservative approach requires that ℓeddy values be set to <22 µm.
Setting a DSC Design Space — Gravitational Force: The relative centrifugal force (g-force) is radial force generated by rotation in a centrifuge relative to gravitational force (Equation 10) (4). Doran explains that DSCs are designed to generate 5,000–15,000g to minimize settling time and centrifuge processing time (18). Cell-culture harvest is a clean process but not a sterile one. Thus, manufacturers aim to complete DSC harvest operations for large-scale (20,000-L) cultures in four to six hours to minimize microbial proliferation. Pham (4) and Monica, Whiteley, and Aktiengesellschaft (19) indicate that they have applied 6,500–7,500g and 8,000–9,000g, respectively, for DSC-based cell-culture harvest. We set the g-force to >5,000g for timely process completion.
Figure 3 presents a contour plot showing ℓeddy, g-force, Q/Σ, and dp,min values as a function of centrifuge feed-flow rate and bowl speed. Values were generated for a 60-L BRPX 618 HGV-34 DSC system (Alfa Laval) used in our company’s biomanufacturing facility, which can perform cell cultures of 20,000 L. The plot displays both risk zones related to shear and settling capacity and an operational space that prevents cell damage while maintaining a reasonable settling capacity. The figure also indicates a narrow Q/Σ range (3.1 × 10⁻⁹ m/s to 4.1 × 10⁻⁹ m/s) as the preferred operating zone. For cell-culture clarification using a DSC, Pham recommends a Q/Σ value ranging from 10–9 m/s to 2.6 × 10⁻⁸ m/s (4). However, experiments described by Maybury et al. and Iammarino et al. show a 6–10% reduction in clarification efficiency as Q/Σ increases from 3.4 × 10⁻⁹ m/s to 1.35 × 10⁻⁸ m/s (20, 21). Those observations align with the centrifuge design space presented in Figure 3.
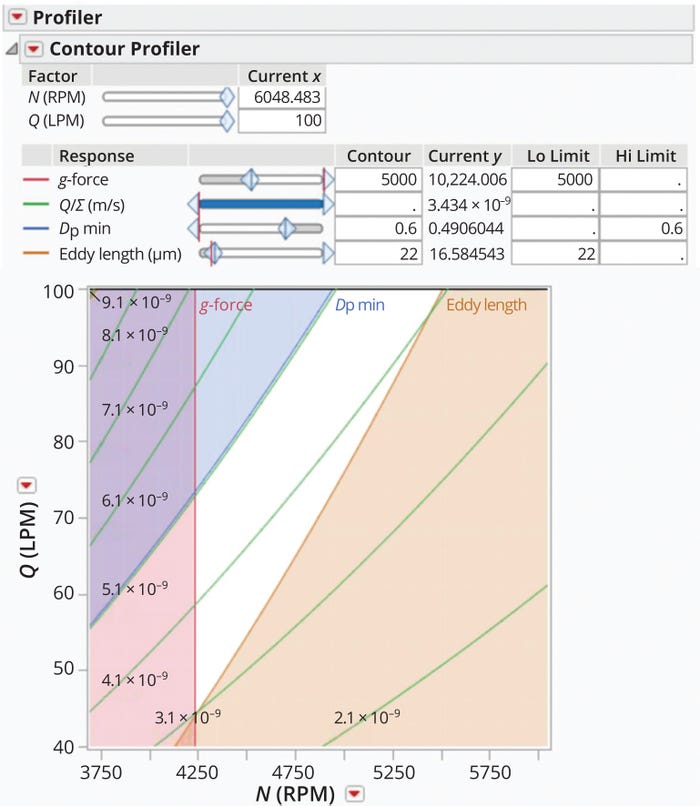
Figure 3: Setting an operational design space for a BRPX 618 HGV-34 disc-stack centrifuge (Alfa Laval).
Method 2: Tip Speed
Average Shear Stress: Boychyn et al. state that the maximum level of shear stress (τmax) for fluid flow over the rotating surface of a disc can be determined using Equation 11 (22). Therein, θtip represents the tip velocity of a disc at radius R. The mean shear across a disc is given by averaging the shear levels at the outer and inner disc radii (Ro and Ri, respectively) (Equation 12).
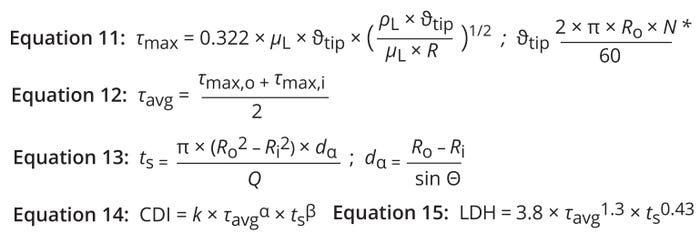
Equations 11–15: Shear assessment based on the tip-speed method. * R = R0 for τmax at Ro ; R = Ri for τmax at Ri.
Shear-Stress Exposure Time:
The degree to which shear harms mammalian cells depends not only on its magnitude, but also on its duration. Ludwig et al. demonstrate that long periods of shear (e.g., 24 hours) can compromise cell morphology at forces of 0.75–1.0 N/m2; however, for short periods (up to an hour), cells can tolerate stresses up to 20 N/m2 (23). Bae et al. write that shear stress of >250 N/m2 is required to induce mechanical damage in CHO cells (24). Thus, biomanufacturers should consider duration of exposure to a shear field when modeling cell damage during clarification. Equation 13 calculates cell residence time along the axial distance in the annular spaces between DSC discs (ts) (4). Using a power-law model, Pham et al. describe cell damage as a function of both shear stress and duration of shear-field exposure (Equation 14) (25).
CDI and Model Fitting for Shear Stress at a Given Tip Speed: Using the Fit Model function in JMP software, we obtained values for the constants in Equation 14. We based our calculations on LDH concentrations from Shekhawata et al. for different operating conditions in a Culturefuge 100 system, using those data points as response variables (13). The τavg and ts values calculated from Equations 12 and 13, respectively, served as explanatory variables. Those inputs yielded values of k = 3.8, α = 1.3, and β = 0.43, which we used to generate a prediction expression (Equation 15).
Figure 4 shows a linear relationship between reported LDH concentrations and Equation 15. An R2 value of 0.98 demonstrates that the predictive expression reliably fits the observed data points. Similarly, the p-value of <0.0001 indicates that the strength of association between the input variable (prediction expression) and output prediction (LDH concentration) has a high degree of statistical significance and that 99.99% of variability in the observed LDH concentrations is explained by the prediction expression. Thus, holding the expression constant could be an effective method for maintaining similar shear levels across scales of DSC operation.
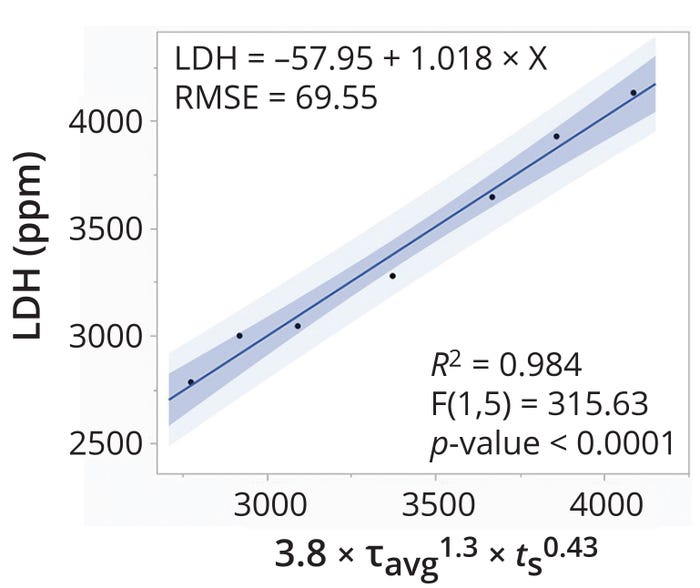
Figure 4: Predictability of shear produced in a disc-stack centrifuge according to the tip-speed method; RMSE = root-mean-square error.
Method 3: Power Dissipation
Average Shear Stress: Murrell demonstrates that power dissipated in a DSC feed zone (Pdis) can be calculated using Equation 16, wherein ω represents the angular velocity (in 1/s) (26). As with the tip-speed model, the impact of dissipated power on cell integrity depends on the exposure duration, which can be calculated as the centrifuge-bowl residence time (tRB) using Equation 17. Therein, Vb signifies the centrifuge-bowl volume. Based on those calculations, the cell damage index can be expressed by a power law as a function of both dissipated power and bowl residence time (Equation 18). We identified the constants in Equation 18 as k = 0.16, α = 0.98, and β = 1.4 based on the CDI and model-fitting method described above. Those values yield the prediction expression shown in Equation 19.

Equations 16–19: Shear assessment based on the power-dissipation method.
Figure 5 shows a linear relationship between LDH concentrations and Equation 19. The R2 value of 0.98 demonstrates the reliability of the predictive expression. The p-value of <0.0001 indicates that the strength of association between the input variable and output prediction have a high degree of statistical significance, with 99.99% of variability in LDH values explained by Equation 19. Thus, holding the prediction expression constant could help to ensure similar shear levels across scales of DSC operation.
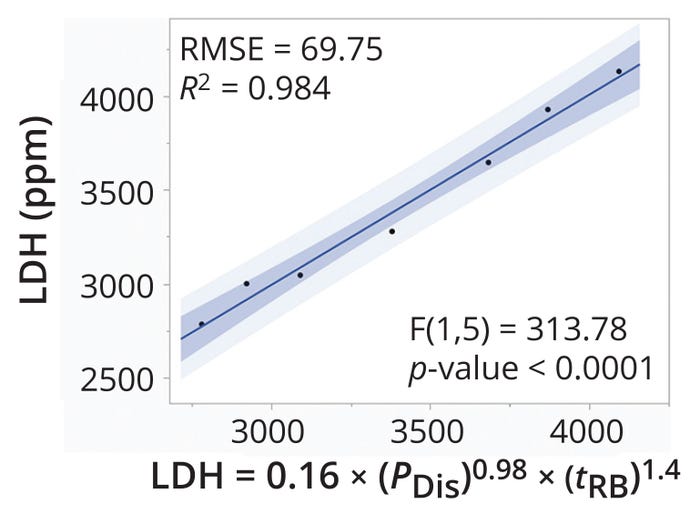
Figure 5: Predictability of shear produced in a disc-stack centrifuge based on the power-dissipation method; RMSE = root-mean-square error.
Conclusions About Shear Assessment for DSC Operation
Biomanufacturers often use DSCs for cell-culture clarification during large-scale biomanufacturing. Although a well-established Q/Σ method is available for scaling centrifuge operating conditions based on particle-settling efficiency, current knowledge about shear assessment for DSC operation remains esoteric. Above, we presented shear-assessment calculations using three methods. We also illustrated applications using a contour profile that presents a balance between particle-settling capacity and shear as a function of bowl speed and centrifuge-feed flow rate.
References
1 Depth Filtration Versus Centrifugation: Determining the Best Approach for Carrying Out Clarification Operations. Gen. Eng. Biotechnol. News 1 September 2014; https://www.genengnews.com/news/depth-filtration-vs-centrifugation.
2 Richardson A, Walker J. Continuous Solids-Discharging Centrifugation: A Solution to the Challenges of Clarifying High-Cell–Density Mammalian Cell Cultures. BioProcess Int. 16(4) 2018: 38–47; https://bioprocessintl.com/downstream-processing/separation-purification/continuous-solids-discharging-centrifugation-a-solution-to-the-challenges-of-clarifying-high-cell-density-mammalian-cell-cultures.
3 Joseph A, et al. A Scale-Down Mimic for Mapping the Process Performance of Centrifugation, Depth, and Sterile Filtration. Biotechnol. Bioeng. 113(9) 2016: 1934–1941; https://doi.org/10.1002/bit.25967.
4 Pham CY. Patent 7157276B2. Use of Depth Filtration in Series with Continuous Centrifugation To Clarify Mammalian Cell Cultures. US Patent and Trademark Office: Washington, DC, 2004; https://image-ppubs.uspto.gov/dirsearch-public/print/downloadPdf/7157276.
5 Mannweiler K. The Recovery of Biological Particles in High-Speed Continuous Centrifuges with Special Reference to Feed-Zone Break-Up Effects (PhD Thesis). University of London: London, UK, 1989; https://discovery.ucl.ac.uk/id/eprint/1318045.
6 Poon C. Measuring the Density and Viscosity of Culture Media for Optimized Computational Fluid Dynamics Analysis of In Vitro Devices. bioRxiv 26 November 2020; https://doi.org/10.1101/2020.08.25.266221.
7 de Nevers N, Silcox GD. Fluid Mechanics for Chemical Engineers, 4th Edition. McGraw Hill: New York, NY, 2021; https://www.mheducation.com/highered/product/fluid-mechanics-chemical-engineers-de-nevers/M9781260475524.html.
8 Muralidharan N. Shear-Proof Design Space: Scaling Stirred-Tank Bioreactors for Cell Culture Processes. BioProcess Int. 21(1–2) 2023: 35–37, 45; https://bioprocessintl.com/upstream-processing/bioreactors/shear-proof-design-space-scaling-stirred-tank-bioreactors-for-cell-culture-processes.
9 Clark DS, Blanch HW. Biochemical Engineering, 2nd Edition. CRC Press: Boca Raton, FL, 1997; https://www.routledge.com/Biochemical-Engineering/Clark-Blanch/p/book/9780824700997.
10 Sylaymon AH, Alwared AI. Prediction of Drag Coefficient for Accelerated Single Sphere in Power Law Fluids. Arab Univ. J. Eng. Sci. 23(1) 2016: 141–153; https://jaaru.org/index.php/auisseng/article/view/86/62.
11 Clift R, Grace JR, Weber ME. Bubbles, Drops, and Particles. Dover: Mineola, NY, 2013; https://store.doverpublications.com/products/9780486317748.
12 Mei R. An Approximate Expression for the Shear Lift Force on a Spherical Particle at Finite Reynolds Number. Int. J. Multiphase Flow 18(1) 1992: 145–147; https://doi.org/10.1016/0301-9322(92)90012-6.
13 Shekhawat LK, et al. Application of CFD in Bioprocessing: Separation of Mammalian Cells Using Disc Stack Centrifuge During Production of Biotherapeutics. J. Biotechnol. 267, 2018: 1–11; https://doi.org/10.1016/j.jbiotec.2017.12.016.
14 Ambler CM. The Theory of Scaling Up Laboratory Data for the Sedimentation Type Centrifuge. J. Biochem. Microbiol. Technol. Eng. 1(2) 1959: 185–205; https://doi.org/10.1002/jbmte.390010206.
15 Parau M, et al. Analysis of Fouling and Breakthrough of Process Related Impurities During Depth Filtration Using Confocal Microscopy. Biotechnol. Prog. 38(2) 2022: e3233; https://doi.org/10.1002/btpr.3233.
16 Maschke RW, et al. Determination of Culture Design Spaces in Shaken Disposable Cultivation Systems for CHO Suspension Cell Cultures. Biochem. Eng. J. 177, 2022: 108224; https://doi.org/10.1016/j.bej.2021.108224.
17 Nienow AW. The Impact of Fluid Dynamic Stress in Stirred Bioreactors – The Scale of the Biological Entity: A Personal View. Chem. Ingen. Technik 93(1–2) 2020: 17–30; https://doi.org/10.1002/cite.202000176.
18 Doran PM. Bioprocess Engineering Principles, 2nd Edition. Academic Press: Waltham, MA, 2013; https://shop.elsevier.com/books/bioprocess-engineering-principles/doran/978-0-08-091770-2.
19 Monica TJ, Whiteley EM, Aktiengesellschaft S. Patent 6773909B2. Concentration and Lysis of Adenovirus-Infected Cells in a Single Unit Operation. US Patent and Trademark Office: Washington, DC, 10 August 2004; https://image-ppubs.uspto.gov/dirsearch-public/print/downloadPdf/6773909.
20 Maybury JP, Hoare M, Dunnill P. The Use of Laboratory Centrifugation Studies To Predict Performance of Industrial Machines: Studies of Shear-Insensitive and Shear-Sensitive Materials. Biotechnol. Bioeng. 67(3) 2000: 265–273; https://pubmed.ncbi.nlm.nih.gov/10620256.
21 Iammarino M, et al. Impact of Cell Density and Viability on Primary Clarification of Mammalian Cell Broth. BioProcess Int. 5(11) 2007: 38–50; https://bioprocessintl.com/downstream-processing/filtration/impact-of-cell-density-and-viability-on-primary-clarification-of-mammalian-cell-broth-110120075.
22 Boychyn M, et al. Characterization of Flow Intensity in Continuous Centrifuges for the Development of Laboratory Mimics. Chem. Eng. Sci. 56(16) 2001: 4759–4770; https://doi.org/10.1016/s0009-2509(01)00139-7.
23 Ludwig A, Kretzmer G, Schügerl K. Determination of a “Critical Shear Stress Level” Applied to Adherent Mammalian Cells. Enzyme Microb. Technol. 14(3) 1992: 209–213; https://doi.org/10.1016/0141-0229(92)90068-y.
24 Bae YB, et al. Microfluidic Assessment of Mechanical Cell Damage By Extensional Stress. Lab on a Chip 16(1) 2016: 96–103; https://doi.org/10.1039/c5lc01006c.
25 Pham OL, et al. Distribution and History of Extensional Stresses on vWF Surrogate Molecules in Turbulent Flow. Sci. Rep. 12, 2022: 171; https://doi.org/10.1038/s41598-021-04034-9.
26 Murrell NJ. An Engineering Study of the Recovery of Shear Sensitive Biological Materials By High Speed Disk Stack Centrifugation (PhD thesis). University College London: London, UK, 1998; https://discovery.ucl.ac.uk/id/eprint/10099092/1/An_engineering_study_of_the_re.pdf.
Tyler Younger and Grace Chan are process engineers in manufacturing science and technology (MSAT), Mark Davis is director of the MSAT team, and corresponding author Naveenganesh Muralidharan ([email protected]) is senior manager of the MSAT team, all at AGC Biologics, 5550 Airport Boulevard, Boulder, CO 80301; https://www.agcbio.com.
You May Also Like


